
Homework Answers
Hi.
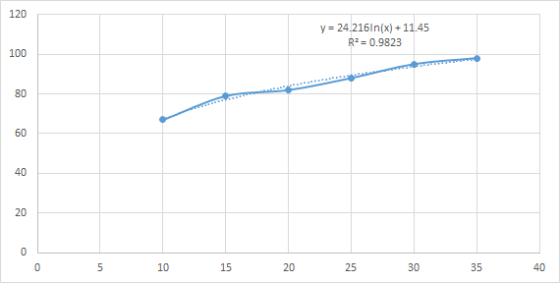
If x is the number of years after 1990 then 2000 is x=10 and so, we first make the following table:
| x | p |
| 10 | 67 |
| 15 | 79 |
| 20 | 82 |
| 25 | 88 |
| 30 | 95 |
| 35 | 98 |
And the logarithmic model will have the following structure:

Then we need to make the following table to calculate a and b
| x | p | Ln(x)=X1 | X1mean | pmean | X1-X1mean | p-pmean | (X1-X1mean)^2 | (p-pmean)^2 | (X1-X1mean)(p-pmean) |
| 10 | 67 | 2.302585 | 3.030298 | 84.83333 | -0.727713046 | -17.83333333 | 0.529566278 | 318.0277778 | 12.97754933 |
| 15 | 79 | 2.70805 | 3.030298 | 84.83333 | -0.322247938 | -5.833333333 | 0.103843734 | 34.02777778 | 1.879779639 |
| 20 | 82 | 2.995732 | 3.030298 | 84.83333 | -0.034565866 | -2.833333333 | 0.001194799 | 8.027777778 | 0.09793662 |
| 25 | 88 | 3.218876 | 3.030298 | 84.83333 | 0.188577686 | 3.166666667 | 0.035561544 | 10.02777778 | 0.597162671 |
| 30 | 95 | 3.401197 | 3.030298 | 84.83333 | 0.370899242 | 10.16666667 | 0.137566248 | 103.3611111 | 3.770808964 |
| 35 | 98 | 3.555348 | 3.030298 | 84.83333 | 0.525049922 | 13.16666667 | 0.275677421 | 173.3611111 | 6.913157309 |
| ∑ | 1.083410023 | 646.8333333 | 26.23639453 |
Where:

And

a) So the model is:

The correlation coefficient can be found by excel:


b)
The year 2032 is x=42 so:

Which basically means that in the year 2032 100% of U.S residents will have internet. The result of p can't be higher than 100
Add Answer to:
12. In 2015, 88% of US residents used the internet, up from 14% in 1995 The table shows the percent who use the internet for selected years from 2000 and projected to 2025. Year 2000 2005 2010 20...
how? 9. In 2015, 88% of US residents used the internet. The table shows the percent who use the internet for selected years from 2000 and projected to 2025. Year Percent 2000 67 2015 2010 82 79 9...
 how?
9. In 2015, 88% of US residents used the internet. The table shows the percent who use the internet for selected years from 2000 and projected to 2025. Year Percent 2000 67 2015 2010 82 79 95 98 (a) Use your calculator to find the natural logarithmic function that models the percent p as a func- tion of x, the number of years after 1990. Report the model with 4 significant digit coefficients. (b) Use the model to predict...
how?
9. In 2015, 88% of US residents used the internet. The table shows the percent who use the internet for selected years from 2000 and projected to 2025. Year Percent 2000 67 2015 2010 82 79 95 98 (a) Use your calculator to find the natural logarithmic function that models the percent p as a func- tion of x, the number of years after 1990. Report the model with 4 significant digit coefficients. (b) Use the model to predict...
19. The percent of U.S. residents using the internet is given in the table below. Year...
 19. The percent of U.S. residents using the internet is given in the table below. Year Users (percent) Year Users (percent) 1997 22.2 2003 59.2 2000 44.1 2004 68.8 2001 50.0 2005 68.1 2002 58.0 2007 70.2 a. Find a logarithmic function that models the data, with x equal to the number years after 1995. b. Use the model to predict the percent of users in 2015. c. Will this model always be valid? Explain
 how?
9. In 2015, 88% of US residents used the internet. The table shows the percent who use the internet for selected years from 2000 and projected to 2025. Year Percent 2000 67 2015 2010 82 79 95 98 (a) Use your calculator to find the natural logarithmic function that models the percent p as a func- tion of x, the number of years after 1990. Report the model with 4 significant digit coefficients. (b) Use the model to predict...
how?
9. In 2015, 88% of US residents used the internet. The table shows the percent who use the internet for selected years from 2000 and projected to 2025. Year Percent 2000 67 2015 2010 82 79 95 98 (a) Use your calculator to find the natural logarithmic function that models the percent p as a func- tion of x, the number of years after 1990. Report the model with 4 significant digit coefficients. (b) Use the model to predict...
 19. The percent of U.S. residents using the internet is given in the table below. Year Users (percent) Year Users (percent) 1997 22.2 2003 59.2 2000 44.1 2004 68.8 2001 50.0 2005 68.1 2002 58.0 2007 70.2 a. Find a logarithmic function that models the data, with x equal to the number years after 1995. b. Use the model to predict the percent of users in 2015. c. Will this model always be valid? Explain
Most questions answered within 3 hours.
-
1. Which region has taken the lead in the world of
e-waste handling?
a) European Union...
asked 1 minute ago -
If you’re standing at the bottom of a hill and asked to evaluate
it while being...
asked 7 minutes ago -
A 8.15- g bullet from a 9-mm pistol has a velocity of 366.0 m/s.
It strikes...
asked 1 hour ago -
The outstanding bonds of Alpha Extracts have a yield to maturity
of 7.4 percent and a...
asked 1 hour ago -
The Problem: The Case of the Harmonizing Vacations
Your CEO is exploring partnering with a European...
asked 2 hours ago -
A chemical equation is balanced by adding coefficients in front
of some formulas so that the...
asked 2 hours ago -
From the literature (reference your sources): What are the
lattice parameters of calcite and aragonite? Why...
asked 3 hours ago -
Your system is rejecting the question am asking which is
preceded by a case study. It...
asked 3 hours ago -
3. On January 2, 2000, Larry creates a trust with himself as
trustee. Larry as trustee...
asked 3 hours ago -
A member of the volleyball team spikes the ball. During this
process, she changes the velocity...
asked 3 hours ago -
Are adult gamers less likely to use a gaming console (Xbox,
PlayStation, Wii, etc...) than teen...
asked 4 hours ago -
The University of
Texas recently reported that 43% of college students aged 18-24
would spend their...
asked 4 hours ago