Question
In 1995 the proportion of people who bought cable was 93%. Since the introduction of streaming services, you have reason to believe that that percentage has changed. A sample of 1000 people in 2017 sa...
In 1995 the proportion of people who bought cable was 93%. Since the introduction of streaming services, you have reason to believe that that percentage has changed. A sample of 1000 people in 2017 saw that the percentage of those people who bought cable was down to 63%. Perform the hypothesis test at the 5% significance level.
1. Conduct the test using the rejection region approach or the p-value approach with a significance level of 0.02.
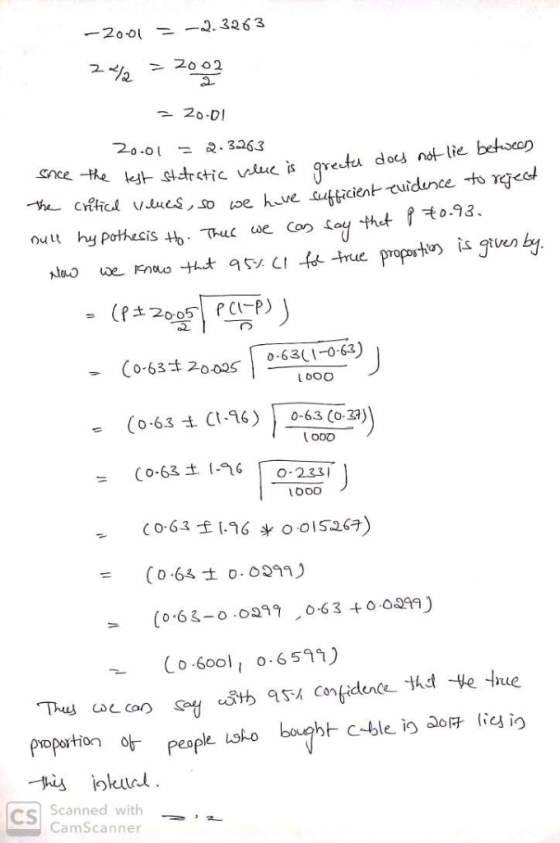
2. Give the 95% confidence interval for the proportion of people who bought cable in 2017, with its interpretation. (I know null hypothesis = .63 and alternative is not = .63)
Homework Answers
Answer #1
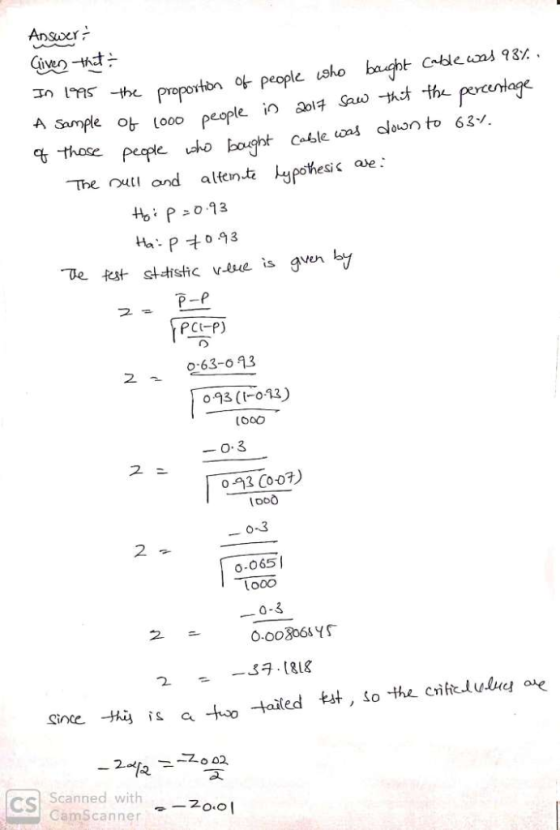
Answer Given -tht: t Cable and 98% . ct fhe percentage A Sample Oly looo people in) 201チG20-thナthe pepie uho boht Clen loto 63 The ull and alent poesic 2-0-63-o 9.3 o 93 (-o-13) -O.3 [Dod o-3 0-065/ Lo0o 0 once-thy is a-ho-tailed tat, so the cıìhe.lulh, ak f2 Scanned with 2o.o CamScanngr Cs
20-ol -Q.3263 -Ke ted-.gtdrctic v.eLie is gredu doy not lie bet seoり PCI-p) (件2005 | = 0.63(1-0-63) LDOO 20025 | Co-63 ) (0.634(t-96) 63(03) o0D (0.64士0.0299) (0.68-0.029 9、063 4,00299) popartion peapk oto CS Scanned with CamScanner
Know the answer?
Add Answer to:
In 1995 the proportion of people who bought cable was 93%. Since the introduction of streaming services, you have reason to believe that that percentage has changed. A sample of 1000 people in 2017 sa...
Not the answer you're looking for?
Ask your own homework help question.
Our experts will answer your question WITHIN MINUTES for Free.
Similar Homework Help Questions
ADVERTISEMENT
Need Online Homework Help?
Ask
a QuestionGet Answers For Free
Most questions answered within 3 hours.
Most questions answered within 3 hours.
ADVERTISEMENT
ADVERTISEMENT
Active Questions
-
(Ratio Analysis): Last year Co. XYZ had sales of $ 400,000, with
“cost of goods sold”...
asked 13 minutes ago -
Ken believes the average age of men who come to get a haircut at
his barber...
asked 5 minutes ago -
can someone please write the balanced chemical
equation for the synthesis of Bromoacetanilide
from;
aniline +...
asked 9 minutes ago -
1. If a corporation purchases land and building and subsequently
tears down the building and uses...
asked 20 minutes ago -
Consider a 23-year bond with 7 percent annual coupon payments.
The market rate (YTM) is 6.4...
asked 23 minutes ago -
a tuba creates a 4th harmonic of frequency 116.5 Hz. what is the
frequency of the...
asked 29 minutes ago -
A coconut mass 2kg falls from a 30m tall tree. The coconut falls
and comes to...
asked 33 minutes ago -
Group Policies
Research GROUP POLICY OBJECTS (GPO'S)
You can start in the Windows Server 2012 eBook...
asked 37 minutes ago -
software engineering
Problems.
Create a use case diagram for class registration for a
university.
Create a...
asked 36 minutes ago -
You are trying to convince your friend who wants to attend
medical school to take BY123...
asked 52 minutes ago -
Subject: C++
I have created a class called QueueOfIntegers in a file called
QueueOfIntegers.h, which is...
asked 51 minutes ago -
calculate the number of molecules of gas in a
container of 2.0 liter at 30 degrees...
asked 1 hour ago
ADVERTISEMENT