
Homework Answers
The question requires the comparitive study of the four rules from Dr. Deming's funnel experiment and make an inference based on it.
But before that let us try ot understand the experiment first.
The experiment is illustrated as to drop a marble through a funnel with the objective of hitting a target.
A funnel is fixed on a stand at a certain distance above a target point say T on a level surface.
A marble is dropped through the funnel. The marble rolls down the funnel and comes to rest at a certain location.
This landing point is recorded. This experiment is repeated for multiple times say 50 drops for each of four different rules which are stated as follows:
Rule 1: Leave the funnel fixed over the target and do not make any adjustments.
Rule 2: After every experiment, move the funnel a distance say -z from its last position where z is the distance of the landing point from the target.
Rule 3: After each experiment, move the funnel a distance -z from the target position where the marble ends up a distance z from the target.
Rule 4: Adjust the funnel to be over its last resting position.
Now we have to pronounce as to which method is the best .
Now we are not given with any data sets to make an assertion .
Hence we took help of a pre designed and pre conducted funnel experiment as per the four rules and inferred the following .
1. x bar chart
A general observation of the x bar chart as per the four rules is as per the following trends
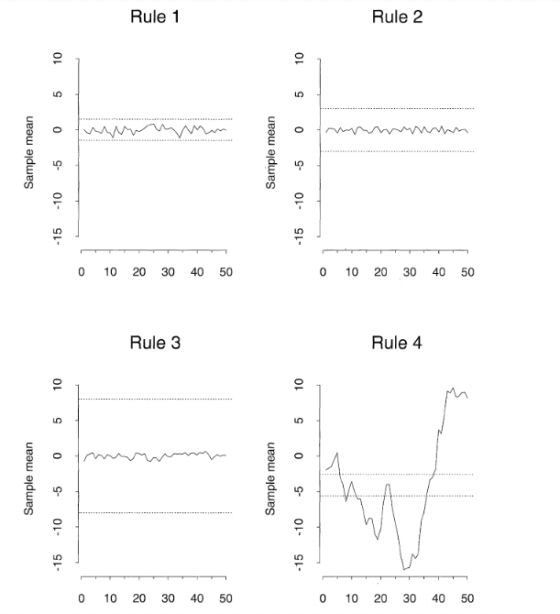
We can see that observations/output based on the control chart is most disciplined as per rule 1 and least discipines as per rule 4 .
Also it can be noted that the control limit band is very narrow for rule 1 and widest for rule 3.
Thus rule 1 gives us the most reliable observations as per hte contorl chart.
2. R chart
The typical R charts ofr the 4 rules are :-
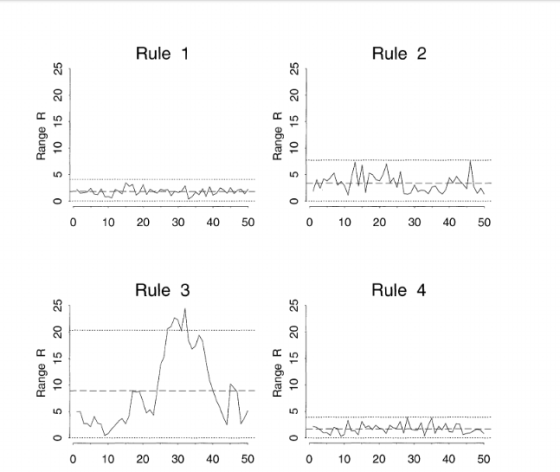
what do you observe?
The variablity is range for rule 1 and 4 is least and under control while that for rule 2 and 3 is high and not under control.
3. Q-Q plot
The Q Q plot gives us as idea of the degree of variablity explianed by the model
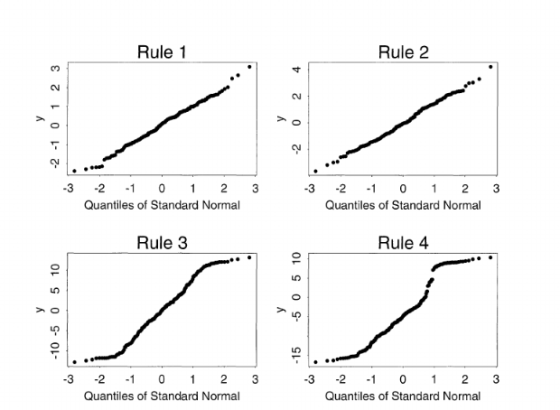
From hte plot above we see that plot under rule 1 has least aberration .
Thus from all the three observations, one this comes out very clearly that rule 1 is the dest method to conduct the funnel experiment .This is so because :-
1. It has least process variablity.
2. It has most reliable process model
3. It has very restricted process band indicating high accuracy .
Add Answer to:
2" (5%) Consider the funnel experiment described by Dr. Deming. The experiment is illustrated as to drop a marble through a funnel with the objective of hitting a target. Imagine that a funnel is...
Read the article below and in your own words, (1-2 sentences) what is the "true direction"...
Read the article below and in your own words, (1-2 sentences) what is the "true direction" or right way to interpret nature, according to Bacon? True Directions Concerning the Interpretation of Nature (1620) Francis Bacon Those who have taken it on themselves to lay down the law of nature as something that has already been discovered and understood, whether they have spoken in simple confidence or in a spirit of professional posturing, have done great harm to philosophy and the...
Most questions answered within 3 hours.
-
What mechanisms Drive speciation??
(I.e. what was Dawins theory on the orgin of species, and how...
asked 49 minutes ago -
The manager at a car assembly plant believes that the mean
assembly time for a car...
asked 1 hour ago -
Which of the following is true of electron capture?
A) It decreases the nuclide's mass number...
asked 3 hours ago -
Assuming an efficiency of 43.10%, calculate the actual yield of
magnesium nitrate formed from 114.9 g...
asked 3 hours ago -
The highly pathogenic bacterium Clostridium
perfringens causes gangrene, a disease that results in the
destruction of...
asked 5 hours ago -
In the context of situation analysis, which of the following is
a category for analysis in...
asked 5 hours ago -
In a study of the gas phase decomposition of sulfuryl chloride
at 600 K SO2Cl2(g)SO2(g) +...
asked 5 hours ago -
75 g of 2-propanol (C3H8O) and 25 g of pentane are mixed in a
200 mL...
asked 5 hours ago -
The 2800-turn coil in a dc motor has an area per turn of 1.1 ×
10-2...
asked 5 hours ago -
Draw a combinational logic circuit diagram with a symbol inside
the box for two I/P of...
asked 5 hours ago -
The cliché we use quite a lot in finance is: there is a need to
maximize...
asked 5 hours ago -
In class we discussed the addition of HCl to alpha pinene. Would
you expect one or...
asked 5 hours ago