
Homework Answers
From the Bode frequency response, it is observed that the initial roll off of the magnitude response is approximately 20 dB /decade.
One pole at origin is responsible for this decay of magnitude. Therefore there is one pole at origin.
It is observed that the high frequency roll off of the magnitude response is approximately 60 dB /decade. This means that there are a total 3 poles. Therefore the number of excess poles = 3 - 1 = 2.
From the initial magnitude response, it is observed that the initial magnitude at w = 0.1rad/sec is 0 dB approximately.
i.e. 20log(K) + 20log(0.1) = 0 dB = 1
=> 20 log(K) = -20 dB => K = 0.1.
From the bode response, the gain margin is computed as given below
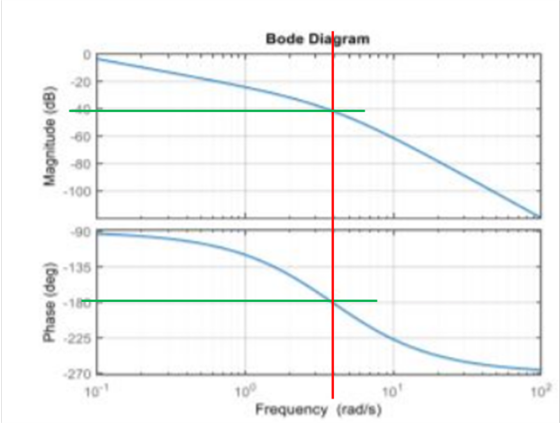
GM = - gain in dB at phase crossover frequency = -(-40 dB) = 40 dB
With K = 1, the magnitude response shifts upwards.
Therefore the new gain margin = 40- 20dB = 20 dB.
The transfer function is approximately given below based on the given information
T(s) = 0.1 /(s*(s+3)^2)
Add Answer to:
Consider the system given below where K is a constant gain, Gp is the plant, and Ge is a compensator. The Bode Plots of a Gp is given below. Problem 1: Bode Diagram 20 2 40 -60 80 -100 90 135 180 a 2...
The Bode plots for a plant, G(s), used in a unity feedback system are shown in Figure P10.7. Do the following: Find the gain margin, phase margin, zero dB frequency, 180° frequency, and the closed-l...
 The Bode plots for a plant, G(s), used in a unity feedback
system are shown in Figure P10.7. Do the following:
Find the gain margin, phase margin, zero dB frequency, 180°
frequency, and the closed-loop bandwidth.
Use your results in Part a to estimate the damping ratio,
percent overshoot, settling time, and peak time.
ANSWERS GIVEN BY PROFESSOR
1. Gain margin = 20dB, Phase margin = 55 deg, Zero dB frequency
= 1rad/s, 180deg frequency = 4.5rad/s, bandwidth (-7dB) closed-loop...
The Bode plots for a plant, G(s), used in a unity feedback
system are shown in Figure P10.7. Do the following:
Find the gain margin, phase margin, zero dB frequency, 180°
frequency, and the closed-loop bandwidth.
Use your results in Part a to estimate the damping ratio,
percent overshoot, settling time, and peak time.
ANSWERS GIVEN BY PROFESSOR
1. Gain margin = 20dB, Phase margin = 55 deg, Zero dB frequency
= 1rad/s, 180deg frequency = 4.5rad/s, bandwidth (-7dB) closed-loop...
KKKM3473/KKKM3314/KKKM3344 The characteristic polynomial of a feedback control system is given by 5. where K>0. Dete...
 KKKM3473/KKKM3314/KKKM3344 The characteristic polynomial of a feedback control system is given by 5. where K>0. Determine the range of values of K for which the system is stable. (10 marks) The closed loop poles of a second order system are located at points -3.5+1.5t and 6. -3.5-1.51 on the complex plane. Calculate the damped natural frequency, ωd. (10 marks) 7. The Bode plots for a first order dynamic system is shown in Figure 3. Estimate the magnitude and phase when...
 The Bode plots for a plant, G(s), used in a unity feedback
system are shown in Figure P10.7. Do the following:
Find the gain margin, phase margin, zero dB frequency, 180°
frequency, and the closed-loop bandwidth.
Use your results in Part a to estimate the damping ratio,
percent overshoot, settling time, and peak time.
ANSWERS GIVEN BY PROFESSOR
1. Gain margin = 20dB, Phase margin = 55 deg, Zero dB frequency
= 1rad/s, 180deg frequency = 4.5rad/s, bandwidth (-7dB) closed-loop...
The Bode plots for a plant, G(s), used in a unity feedback
system are shown in Figure P10.7. Do the following:
Find the gain margin, phase margin, zero dB frequency, 180°
frequency, and the closed-loop bandwidth.
Use your results in Part a to estimate the damping ratio,
percent overshoot, settling time, and peak time.
ANSWERS GIVEN BY PROFESSOR
1. Gain margin = 20dB, Phase margin = 55 deg, Zero dB frequency
= 1rad/s, 180deg frequency = 4.5rad/s, bandwidth (-7dB) closed-loop...
 KKKM3473/KKKM3314/KKKM3344 The characteristic polynomial of a feedback control system is given by 5. where K>0. Determine the range of values of K for which the system is stable. (10 marks) The closed loop poles of a second order system are located at points -3.5+1.5t and 6. -3.5-1.51 on the complex plane. Calculate the damped natural frequency, ωd. (10 marks) 7. The Bode plots for a first order dynamic system is shown in Figure 3. Estimate the magnitude and phase when...
Most questions answered within 3 hours.
-
Hello, can someone please help me answer this question?
How much heat is absorbed by a...
asked 11 minutes ago -
A business executive has the option to invest money in two
plans: Plan A guarantees that...
asked 12 minutes ago -
. A marketing researcher conducted a survey of 25 shoppers
randomly selected at the local mall...
asked 27 minutes ago -
Create an comprehensive response to the
following:
Antimicrobial agents work on a multitude of microbes (bacteria,...
asked 29 minutes ago -
6.13 LAB: Step counter. Section 6.3.
A pedometer treats walking 2,000 steps as walking 1 mile....
asked 24 minutes ago -
(14.2) A block of mass m = 10 kg riding on a frictionless
horizontal plane is...
asked 27 minutes ago -
Use any search engine to search for articles about Starbucks
partnership with Tata Companies in India...
asked 26 minutes ago -
Let’s say that for some reason Bank Excess Reserves suddenly
increase sharply. What effect would this...
asked 35 minutes ago -
Given:
Curent Assets: $600,000
Total Assets: $2,600,000
Current Liabilities: $500,000
Total Liabilities: $1,700,000
What is the...
asked 40 minutes ago -
1. What is a “Bankster”? What is insider trading? Why is it
illegal?
2. What is...
asked 38 minutes ago -
A transverse wave on a cord is given by
D(x,t)=0.18sin(2.7x−61.0t), where Dand x are in m...
asked 45 minutes ago -
ASSIGNMENT
ANSWER ANY TWO OF THE FOLLOWING IN 2-3 PARAGRAPHS OF EACH
QUESTION.
1: Where is...
asked 43 minutes ago