
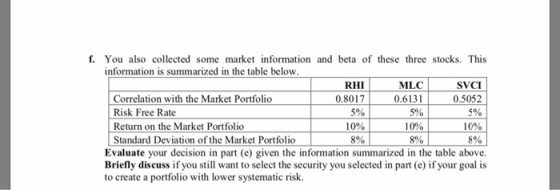
f. You also collected some market information and beta of these three stocks. This information is summarized in the table below SVCI MLC RHI 0.5052 5% 0.6131 0.8017 Correlation with the Market Portfolio 5% 5% Risk Free Rate 10% 10% 10% Return on the Market Portfolio 8% 8% 890 Standard Deviation of the Market Portfolio Evaluate your decision in part (e) given the information summarized in the table above. Briefly discuss if you still want to select the security you selected in part (e) if your goal is to create a portfolio with lower systematic risk
Homework Answers
| RHI STOCK ANALYSIS | ||||||||||
| P | R | P*R | D=(R-23.8) | E=D^2 | F=E*P | |||||
| State | Probability | Return | Probabilty *Return | Deviation from Mean | Deviation Squared | Deviation Squared*Probability | ||||
| Boom | 0.3 | 38 | 11.4 | 14.2 | 201.64 | 60.492 | ||||
| Neutral | 0.5 | 20 | 10 | -3.8 | 14.44 | 7.22 | ||||
| Reccession | 0.2 | 12 | 2.4 | -11.8 | 139.24 | 27.848 | ||||
| SUM | 23.80 | SUM | 95.56 | |||||||
| Mean Return | 23.8 | |||||||||
| Variance of Return | 95.56 | |||||||||
| Standard Deviation | 9.78 | (Square Root (95.56) | ||||||||
| a | Expected Return of RHI | 23.80% | ||||||||
| Standard Deviation of RHI | 9.78% | |||||||||
| MLC STOCK ANALYSIS | ||||||||||
| P | R | P*R | D=(R-18.7) | E=D^2 | F=E*P | |||||
| State | Probability | Return | Probabilty *Return | Deviation from Mean | Deviation Squared | Deviation Squared*Probability | ||||
| Boom | 0.3 | 35 | 10.5 | 16.3 | 265.69 | 79.707 | ||||
| Neutral | 0.5 | 14 | 7 | -4.7 | 22.09 | 11.045 | ||||
| Reccession | 0.2 | 6 | 1.2 | -12.7 | 161.29 | 32.258 | ||||
| SUM | 18.70 | SUM | 123.01 | |||||||
| Mean Return | 18.70 | |||||||||
| Variance of Return | 123.01 | |||||||||
| Standard Deviation | 11.09 | (Square Root (123.01) | ||||||||
| b | Expected Return of MLC | 18.70% | ||||||||
| Standard Deviation of MLC | 11.09% | |||||||||
| COVARIANCE BETWEEN RETURN OF RHI and MLC | ||||||||||
| P | D1 | D2 | P*D1*D2 | |||||||
| State | Probability | Deviation from Mean of RHI | Deviation from Mean of MLC | Deviation RHI*DeviationMLC*Probability | ||||||
| Boom | 0.3 | 14.2 | 16.3 | 69.438 | ||||||
| Neutral | 0.5 | -3.8 | -4.7 | 8.93 | ||||||
| Reccession | 0.2 | -11.8 | -12.7 | 29.972 | ||||||
| SUM | 108.34 | |||||||||
| Covariance (RHI,MLC) | 108.34 | |||||||||
| c | Weight of stock RHI | 0.56 | (14000/25000) | |||||||
| Weight of stock MLC | 0.44 | (1-0.56) | ||||||||
| Expected Portfolio Return : | ||||||||||
| (Weight of RHI*Mean Return of RHI)+(Weight of MLC*Mean Return of MLC) | ||||||||||
| Expected Portfolio Return : | 21.56% | (0.56*23.8)+(0.44*18.7) | ||||||||
| Standard Deviation Of Portfolio: | ||||||||||
| Vp=Portfolio Variance =(w1^2)*(S1^2)+(w2^2)*(S2^2)+2*w1*w2*Covariance(1,2) | ||||||||||
| w1=weight of stock 1= | 0.56 | |||||||||
| w2=weight of stock 2= | 0.44 | |||||||||
| S1=Standard Deviation of Stock1= | 9.78 | |||||||||
| S2=Standard Deviation of Stock2= | 11.09 | |||||||||
| Covariance(1,2)= | 108.34 | |||||||||
| Portfolio Variance= | 107.172304 | |||||||||
| Portfolio Standard Deviation | 10.35% | (Square Root of 107.17) | ||||||||
 |
||||||||||
Add Answer to:
1. You are working in a financial intermediary and your manager asks you to analyze stocks of two different companies trading on Borsa İstanbul. The first company is called R&H Inc. (RHI) an...
Question 1: You are planning about putting some money in the stock market. There are two...
Question 1: You are planning about putting some money in the stock market. There are two stocks in your mind: stock A and stock B. The economy can either go in recession or it will boom in the coming years. Being an optimistic investor, you believe the likelihood of observing an economic boom is two times as high as observing an economic depression. You also know the following about your two stocks: State of the Economy Probability RA RB Boom...
Suppose the expected returns and standards deviations of two stocks were stock A: E (R) =9%,...
Suppose the expected returns and standards deviations of two stocks were stock A: E (R) =9%, STANDARD DEVIATION = 36% STOCK B: E (R) = 15%, STANDARD DEVIATION = 62% A. calculate the expected return of a portfolio that is composed of 35% of stock A and 65% of stock B. b. calculate the standard deviation of this portfolio when the correlation coefficient between the returns is 0.5 c. calculate the standard deviation of this portfolio (same weights in each...
Based on your research, you have already invested 20% of your savings in Stock X, which...
Based on your research, you have already invested 20% of your savings in Stock X, which has a standard deviation of returns of 0.70. You want to diversify your risk and invest the remaining of your savings in one of the two other stocks based on your research: Stock A or Stock B. Standard deviation of the returns for Stock A is 0.83. The covariance of the returns between Stock X and A is –0.75. Whereas returns for Stock B...
Mary has access to risky stocks A and B. But she has no access to risk-free...
 Mary has access to risky stocks A and B. But she has no access to risk-free T-bills. The two assets have the following characteristics: Stock A: Expected return= 12.5% per annum, Standard deviation=14% per annum Stock B: Expected return = 5% per annum. Standard deviation=8% per annum The correlation coefficient between retum on stock A and return on stock B is 0.10 Mary's utility function U = E(R)- Ao and her coefficient of risk aversion is equal to 3 a)...
1. Compute the expected return for a company that will be traded at $100, $120, and $140 next per...
1. Compute the expected return for a company that will be traded at $100, $120, and $140 next period with probabilities 20%, 40%, and 40%, respectively. The price of that company today is $110. 2. Compute the correlation between assets A and B if you know that the standard deviation of B is 50% of the standard deviation of A and the covariance between the two assets is 0.5 times the variance of asset A. 3. What is the risk...
Pinulo retums? 1 0 capital asset pricing model given historical data 2. Consider Table 1. (%)...
 Pinulo retums? 1 0 capital asset pricing model given historical data 2. Consider Table 1. (%) 3.77 Table 1 Summary Statistics Alpha, Beta, Expected Return and Variance a/c to the Stocks Sample Single Index Model Covariance Residual and Return Alpha Beta with Market Expected Variance Variance Market (%) (%) Return (%) (%) 3.60 3.59 4.80 Market 4.20 0.00 8.70 (a) Consider Table 1. Using the single index model, calculate beta and alpha for stocks 1 and 2. Interpret your findings....
Historical Realized Rates of Return You are considering an investment in either individual stocks or a...
 Historical Realized Rates of Return You are considering an investment in either individual stocks or a portfolio of stocks. The two stocks you are researching, Stock A and Stock B, have the following historical returns: Year 2014 2015 2016 2017 2018 -22.80% 39.25 24.75 -6.75 34.50 -5.50 % 20.30 -10.20 48.10 16.25 a. Calculate the average rate of return for each stock during the 5-year period. Do not round Intermediate calculations. Round your answers to two decimal places. Stock A:...
6. Consider the following information for Stocks 1 and 2: Expected Standard Stock Return Deviation 1...
 6. Consider the following information for Stocks 1 and 2: Expected Standard Stock Return Deviation 1 20% 40% 2 12% 20% NE a. The correlation between the returns of these two stocks is 0.3. How will you divide your money between Stocks 1 and 2 if your aim is to achieve a portfolio with an expected return of 18% p.a.? That is, what are the weights assigned to each stock? Also take note of the risk (i.e., standard deviation) of...
Consider the following returns of two stocks in conjunction with the market M Std. dev. of...
 Consider the following returns of two stocks in conjunction with the market M Std. dev. of stock1 Std. dev. of stock 2 Std. dev. of market Expected return on the market rM 1096 Corr. of stock 1 with the market piM Corr. of stock 2 with the market p2M 0.7 Risk free rate T1 2096 T2 3096 15% 0.4 . According to the CAPM, what should the expected return of stock 1 and stock 2 be? (Note: Your answer should...
 Mary has access to risky stocks A and B. But she has no access to risk-free T-bills. The two assets have the following characteristics: Stock A: Expected return= 12.5% per annum, Standard deviation=14% per annum Stock B: Expected return = 5% per annum. Standard deviation=8% per annum The correlation coefficient between retum on stock A and return on stock B is 0.10 Mary's utility function U = E(R)- Ao and her coefficient of risk aversion is equal to 3 a)...
 Mary has access to risky stocks A and B. But she has no access to risk-free T-bills. The two assets have the following characteristics: Stock A: Expected return= 12.5% per annum, Standard deviation=14% per annum Stock B: Expected return = 5% per annum. Standard deviation=8% per annum The correlation coefficient between retum on stock A and return on stock B is 0.10 Mary's utility function U = E(R)- Ao and her coefficient of risk aversion is equal to 3 a)...
 Pinulo retums? 1 0 capital asset pricing model given historical data 2. Consider Table 1. (%) 3.77 Table 1 Summary Statistics Alpha, Beta, Expected Return and Variance a/c to the Stocks Sample Single Index Model Covariance Residual and Return Alpha Beta with Market Expected Variance Variance Market (%) (%) Return (%) (%) 3.60 3.59 4.80 Market 4.20 0.00 8.70 (a) Consider Table 1. Using the single index model, calculate beta and alpha for stocks 1 and 2. Interpret your findings....
 Historical Realized Rates of Return You are considering an investment in either individual stocks or a portfolio of stocks. The two stocks you are researching, Stock A and Stock B, have the following historical returns: Year 2014 2015 2016 2017 2018 -22.80% 39.25 24.75 -6.75 34.50 -5.50 % 20.30 -10.20 48.10 16.25 a. Calculate the average rate of return for each stock during the 5-year period. Do not round Intermediate calculations. Round your answers to two decimal places. Stock A:...
 6. Consider the following information for Stocks 1 and 2: Expected Standard Stock Return Deviation 1 20% 40% 2 12% 20% NE a. The correlation between the returns of these two stocks is 0.3. How will you divide your money between Stocks 1 and 2 if your aim is to achieve a portfolio with an expected return of 18% p.a.? That is, what are the weights assigned to each stock? Also take note of the risk (i.e., standard deviation) of...
 Consider the following returns of two stocks in conjunction with the market M Std. dev. of stock1 Std. dev. of stock 2 Std. dev. of market Expected return on the market rM 1096 Corr. of stock 1 with the market piM Corr. of stock 2 with the market p2M 0.7 Risk free rate T1 2096 T2 3096 15% 0.4 . According to the CAPM, what should the expected return of stock 1 and stock 2 be? (Note: Your answer should...
Most questions answered within 3 hours.
-
Consider the competitive environment of Starbuck's, Progressive
Insurance, a manufacturing firm with low turnover, or a...
asked 33 minutes ago -
3. Gains from trade
Consider two neighbouring island countries called Euphoria and
Contente. They each have...
asked 2 hours ago -
A business executive has the option to invest money in two
plans: Plan A guarantees that...
asked 4 hours ago -
Hello, can someone please help me answer this question?
How much heat is absorbed by a...
asked 4 hours ago -
. A marketing researcher conducted a survey of 25 shoppers
randomly selected at the local mall...
asked 5 hours ago -
Create an comprehensive response to the
following:
Antimicrobial agents work on a multitude of microbes (bacteria,...
asked 5 hours ago -
6.13 LAB: Step counter. Section 6.3.
A pedometer treats walking 2,000 steps as walking 1 mile....
asked 4 hours ago -
(14.2) A block of mass m = 10 kg riding on a frictionless
horizontal plane is...
asked 5 hours ago -
Use any search engine to search for articles about Starbucks
partnership with Tata Companies in India...
asked 5 hours ago -
Let’s say that for some reason Bank Excess Reserves suddenly
increase sharply. What effect would this...
asked 5 hours ago -
Given:
Curent Assets: $600,000
Total Assets: $2,600,000
Current Liabilities: $500,000
Total Liabilities: $1,700,000
What is the...
asked 5 hours ago -
1. What is a “Bankster”? What is insider trading? Why is it
illegal?
2. What is...
asked 5 hours ago