This question relates to Question 2. Suppose the environmentalist wanted to check if the air quality had improved in recent years. A more comprehensive study was thus conducted in 2018. This time the...
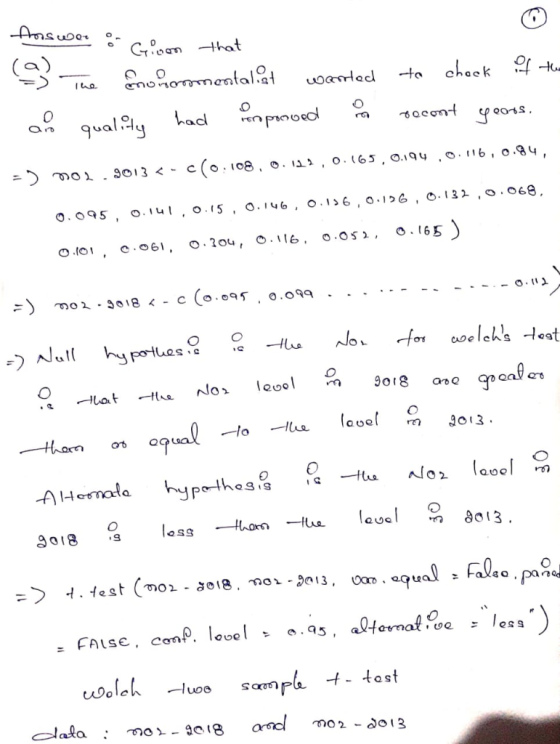
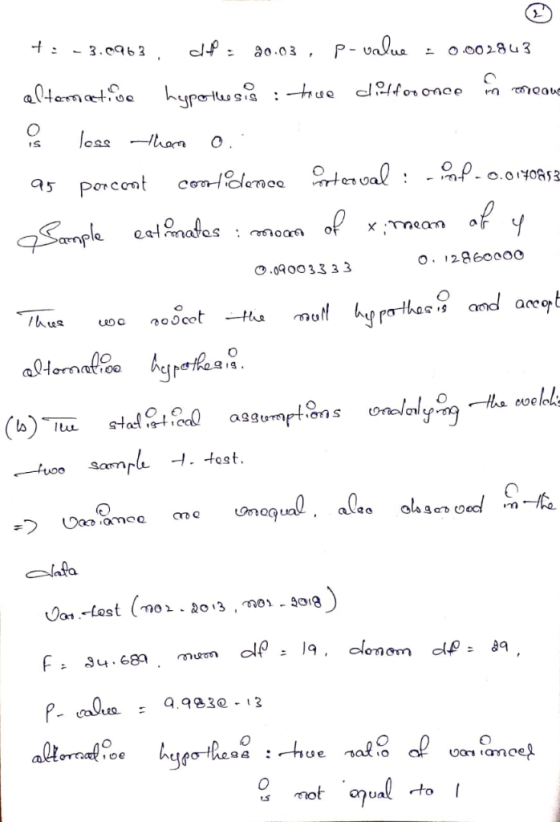
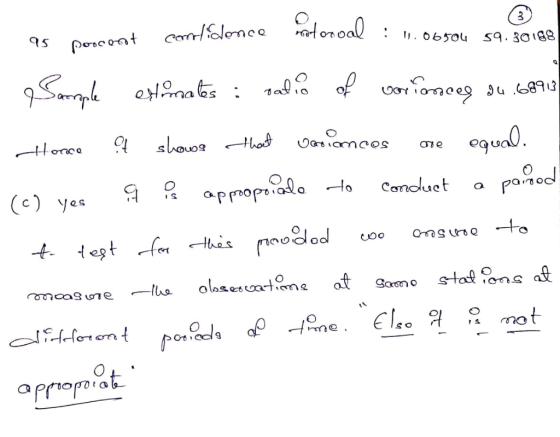
This question relates to Question 2. Suppose the environmentalist wanted to check if the air quality had improved in recent years. A more comprehensive study was thus conducted in 2018. This time the concentration of NO2 was measured hourly at thirty randomly selected monitoring stations. The data are stored in q5.csv. (a) Using Welch’s two-sample t test, determine if the NO2 levels have significantly lowered. Test using the 5% level of significance. [6 marks] [Hint: you will need to combine the two datasets in a particular format in order to perform the test using R Commander. Check Section 7.2 of the Study Guide.] (b) State the statistical assumptions underlying the Welch’s two-sample t test. Demonstrate if the assumptions are valid or not for these data. [3 marks] (c) Is it appropriate to use the paired t test to conduct the test here? Explain your answer. [2 marks]
( Question 2 was The dataset below contains the concentration of NO2 measured hourly measured at twenty randomly selected monitoring stations across Australia in 2013. According to the National Air Quality Standards1 , it is a concern if the NO2 concentration exceeds 0.12 ppm. An environmentalist wished to know if there is a concern or not. (a) Based on the information provided, write down the null and alternative hypotheses that the environmentalist would like to test. [1 mark] (b) Write down the name of the test you are going to use. [1 mark] (c) Write down the decision rule. [1 mark] (d) Paste the output from R Commander. (If you would like to do it by hand, calculate the test statistic and show the steps.) [1 mark] (e) Do you reject the null hypothesis or not? Explain your answer. [1 mark] (f) Draw a conclusion which answers the original problem. [1 mark] (g) State and check all the assumptions for the hypothesis test you have used. [3 marks]
dataset: Question 2
| NO2_2013 |
| 0.108 |
| 0.122 |
| 0.165 |
| 0.194 |
| 0.116 |
| 0.084 |
| 0.095 |
| 0.141 |
| 0.15 |
| 0.146 |
| 0.126 |
| 0.126 |
| 0.132 |
| 0.068 |
| 0.101 |
| 0.061 |
| 0.304 |
| 0.116 |
| 0.052 |
| 0.165 |
Data for question 5:
| NO2_2018 |
| 0.095 |
| 0.099 |
| 0.099 |
| 0.083 |
| 0.092 |
| 0.087 |
| 0.098 |
| 0.096 |
| 0.098 |
| 0.104 |
| 0.093 |
| 0.082 |
| 0.079 |
| 0.098 |
| 0.097 |
| 0.082 |
| 0.07 |
| 0.09 |
| 0.089 |
| 0.096 |
| 0.097 |
| 0.094 |
| 0.089 |
| 0.076 |
| 0.078 |
| 0.097 |
| 0.096 |
| 0.076 |
| 0.059 |
| 0.112 |
Homework Answers
Add Answer to:
This question relates to Question 2. Suppose the environmentalist wanted to check if the air quality had improved in recent years. A more comprehensive study was thus conducted in 2018. This time the...
Suppose the environmentalist wanted to check if the air quality had improved in recent years. A...
Suppose the environmentalist wanted to check if the air quality had improved in recent years. A more comprehensive study was thus conducted in 2018. This time the concentration of NO2 was measured hourly at thirty randomly selected monitoring stations. The data: NO2_2018 0.095 0.099 0.099 0.083 0.092 0.087 0.098 0.096 0.098 0.104 0.093 0.082 0.079 0.098 0.097 0.082 0.07 0.09 0.089 0.096 0.097 0.094 0.089 0.076 0.078 0.097 0.096 0.076 0.059 0.112 (a) Using Welch’s two-sample t test, determine if...
\The dataset below contains the concentration of NO2 measured hourly measured at twenty randomly selected monitoring stations across Australia in 2013. According to the National Air Quality Standards1...
\The dataset below contains the concentration of NO2 measured hourly measured at twenty randomly selected monitoring stations across Australia in 2013. According to the National Air Quality Standards1 , it is a concern if the NO2 concentration exceeds 0.12 ppm. An environmentalist wished to know if there is a concern or not. (a) Based on the information provided, write down the null and alternative hypotheses that the environmentalist would like to test. [1 mark] (b) Write down the name of...
Most questions answered within 3 hours.
-
D. A student completed 20 courses in the School of Arts and
Sciences. Her grades in...
asked 1 hour ago -
teo
pucks moving on a frictionless air table are about to collide. the
1.5 kg puck...
asked 1 hour ago -
Problem #1
The area between Z = 0 and Z = 2.50
The area between Z...
asked 3 hours ago -
1. What is the meaning of the term communication style?
2. What are the benefits to...
asked 2 hours ago -
9.) You are buying a car that cost $26,500. You make payments of
$412 each month...
asked 3 hours ago -
. Suppose a discrete random variable has probability
distribution
P(x) = .2 if x = 0...
asked 4 hours ago -
Under the influence of its drive force, a snowmobile is moving
at a constant velocity along...
asked 4 hours ago -
Why do organizations decline? What steps can top
management take to halt, decline, and restore organizational...
asked 4 hours ago -
What mechanisms Drive speciation??
(I.e. what was Dawins theory on the orgin of species, and how...
asked 6 hours ago -
The manager at a car assembly plant believes that the mean
assembly time for a car...
asked 7 hours ago -
Which of the following is true of electron capture?
A) It decreases the nuclide's mass number...
asked 8 hours ago -
Assuming an efficiency of 43.10%, calculate the actual yield of
magnesium nitrate formed from 114.9 g...
asked 9 hours ago