1. Develop a simulation model in SPSS for a three-year financial analysis of total profit based on the following data and information. Sales volume in the first year is 100,000 units and is projected...
1. Develop a simulation model in SPSS for a three-year financial
analysis of total profit based on the following data and
information. Sales volume in the first year is 100,000 units and is
projected to grow at a rate that is normally distributed with a
mean of 7% per year and a standard deviation of 4%. The selling
price is $10 and the price increase each year is normally
distributed with a mean of $0.50 and a standard deviation of $0.05
each year. Per-unit variable costs are $3, and annual fixed costs
are $200,000. Per-unit variable costs are expected to increase by
an amount normally distributed with a mean of 5% per a year and a
standard deviation of 2%. Fixed costs are expected to increase
following a normal distribution with a mean of 10% per year and a
standard deviation of 3%.
Report the descriptive statistics for profit each year and the
cumulative profit. How confident are you that profits will increase
each year? Use the percentiles report to answer this question and
provide appropriate evidence. (NOTE: Sales, prices, and
costs are NOT uncertain but rather the growth in each of these is
uncertain. You should get a new growth value each year for each of
the four variables for a total of eight uncertain
items.)
Homework Answers
Answer:
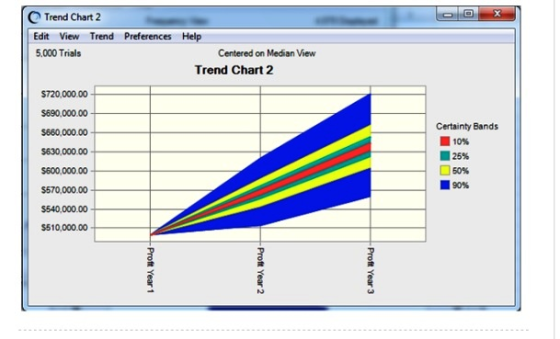
Financial Analysis Model is given as:
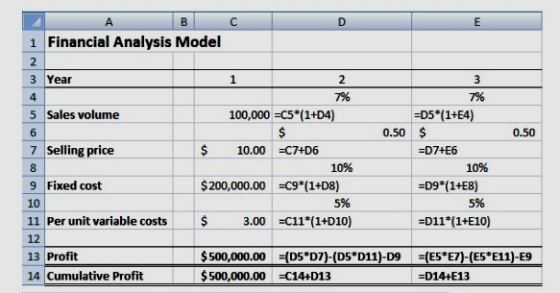
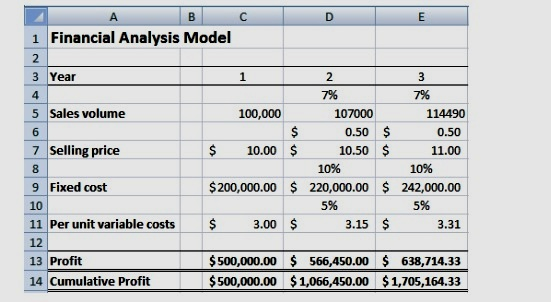
Now it is


Add Answer to:
1. Develop a simulation model in SPSS for a three-year financial analysis of total profit based on the following data and information. Sales volume in the first year is 100,000 units and is projected...
For a new product, sales volume in the first year is estimated to be 80,000 units...
For a new product, sales volume in the first year is estimated to be 80,000 units and is projected to grow at a rate of 4% per year. The selling price is $12 and will increase by $0.50 each year. Per-unit variable costs are $3, and annual fixed costs are $400,000. Per-unit costs are expected to increase 5% per year. Fixed costs are expected to increase 8% per year. Develop a spreadsheet model to calculate the net present value of...
For a New product, sales volume in the first year is estimated to be 80,000 units...
For a New product, sales volume in the first year is estimated to be 80,000 units and is projected to grow at a rate of 4% per year. the selling price is $12 and will increase by $0.50 each year. Per -unit variable costs are $3, and annual fixed costs are $400000. Per-unit costs are expected to increase 5% per year. Fixed costs are expected to increase 8% per year. develope a spread sheet model to calculate the net present...
Develop a Crystal Ball model for the garage band in Problem with the following assumptions. The...
Develop a Crystal Ball model for the garage band in Problem with the following assumptions. The expected crowd is normally distributed with a mean of 3,000 and a standard deviation of 400 (minimum of 0). The average expenditure on concessions is also normally distributed with mean $15, standard deviation $3, and minimum 0. Identify the mean profit, the minimum observed profit, maximum observed profit, and the probability of achieving a positive profit. Develop and interpret a confidence interval for the...
The following information is available for year 1 for Pepper Products: Sales revenue (210,000 units)...
 The following information is available for year 1 for Pepper
Products:
Sales revenue (210,000 units)
$
3,150,000
Manufacturing costs
Materials
$
168,000
Variable cash costs
142,400
Fixed cash costs
327,600
Depreciation (fixed)
989,000
Marketing and administrative costs
Marketing (variable, cash)
422,400
Marketing depreciation
159,600
Administrative (fixed, cash)
509,200
Administrative depreciation
84,800
Total costs
$
2,803,000
Operating profits
$
347,000
All depreciation charges are fixed and are expected to remain the
same for year 2. Sales volume is expected...
The following information is available for year 1 for Pepper
Products:
Sales revenue (210,000 units)
$
3,150,000
Manufacturing costs
Materials
$
168,000
Variable cash costs
142,400
Fixed cash costs
327,600
Depreciation (fixed)
989,000
Marketing and administrative costs
Marketing (variable, cash)
422,400
Marketing depreciation
159,600
Administrative (fixed, cash)
509,200
Administrative depreciation
84,800
Total costs
$
2,803,000
Operating profits
$
347,000
All depreciation charges are fixed and are expected to remain the
same for year 2. Sales volume is expected...
The following information is available for year 1 for Pepper Products: Sales revenue (240,000 units)...
 The following information is available for year 1 for Pepper
Products:
Sales revenue (240,000 units)
$
3,840,000
Manufacturing costs
Materials
$
226,000
Variable cash costs
192,000
Fixed cash costs
442,000
Depreciation (fixed)
1,348,000
Marketing and administrative costs
Marketing (variable, cash)
570,000
Marketing depreciation
202,000
Administrative (fixed, cash)
687,000
Administrative depreciation
101,000
Total costs
$
3,768,000
Operating profits
$
72,000
All depreciation charges are fixed and are expected to remain the
same for year 2. Sales volume is expected...
The following information is available for year 1 for Pepper
Products:
Sales revenue (240,000 units)
$
3,840,000
Manufacturing costs
Materials
$
226,000
Variable cash costs
192,000
Fixed cash costs
442,000
Depreciation (fixed)
1,348,000
Marketing and administrative costs
Marketing (variable, cash)
570,000
Marketing depreciation
202,000
Administrative (fixed, cash)
687,000
Administrative depreciation
101,000
Total costs
$
3,768,000
Operating profits
$
72,000
All depreciation charges are fixed and are expected to remain the
same for year 2. Sales volume is expected...
9. Given the following information, find fixed costs: a. Total sales, $104,672 profit, $18.000; v...
 Question 9 10. Thanks for your help
9. Given the following information, find fixed costs: a. Total sales, $104,672 profit, $18.000; variable rate, 42 h Profit, $12.000: number of customers, 32392; variable cost per unit. c. Sales price per unit, $1460; profit, $34,000, number of customers. price per unit, $18.40: number of custom- $4.63; sales price per unit, $10.34 26,712; variable rate, 35 ers, 26,549: profit, $33,000 d. Contribution rate, 65; sales 10. Given the following information, find profit xed...
Question 9 10. Thanks for your help
9. Given the following information, find fixed costs: a. Total sales, $104,672 profit, $18.000; variable rate, 42 h Profit, $12.000: number of customers, 32392; variable cost per unit. c. Sales price per unit, $1460; profit, $34,000, number of customers. price per unit, $18.40: number of custom- $4.63; sales price per unit, $10.34 26,712; variable rate, 35 ers, 26,549: profit, $33,000 d. Contribution rate, 65; sales 10. Given the following information, find profit xed...
24-12. Cost-volume-profit analysis. Three cor.panies are each producing and selling annually 10,000 units of a similar...
 24-12. Cost-volume-profit analysis. Three cor.panies are each producing and selling annually 10,000 units of a similar product at a unit sales price of $10. The companies have fixed and var able costs as follows: COMPANY FIxED CoST $20,000 40.000 60,000 VARIABLE COST PER UNIT $6 Each company contemplates a price cut, from $10 to $8, in the expectation that sales w increase from 10,000 to 15,000 units per year Required (1) The contribution margin and operating income for each company...
The following information is available for year 1 for Pepper Products: Sales revenue (200,000 units)...
The following information is available for year 1 for Pepper Products: Sales revenue (200,000 units) $ 2,850,000 Manufacturing costs Materials $ 168,000 Variable cash costs 142,400 Fixed cash costs 327,600 Depreciation (fixed) 999,000 Marketing and administrative costs Marketing (variable, cash) 422,400 Marketing depreciation 149,600 Administrative (fixed, cash) 509,200 Administrative depreciation 74,800 Total costs $ 2,793,000 Operating profits $ 57,000 All depreciation charges are fixed and are expected to remain the same for year 2. Sales volume is expected...
A manufacturer of laptop computers wishes to simulate profit per week. On an Excel worksheet, perform...
A manufacturer of laptop computers wishes to simulate profit per week. On an Excel worksheet, perform the simulation using 1,000 trials. The profit equation is: Z = VP – CF – VCV, where the symbols have the meanings given in the text. The assumptions are: Demand ( V ) is normally distributed with a mean of 1,250 computers and a standard deviation of 100 computers Price ( P ) is uniformly distributed from $700 to $850 per computer Fixed costs...
The following information is available for year 1 for Pepper Products: Sales revenue (200,000 units)...
The following information is available for year 1 for Pepper Products: Sales revenue (200,000 units) $ 2,850,000 Manufacturing costs Materials $ 168,000 Variable cash costs 142,400 Fixed cash costs 327,600 Depreciation (fixed) 999,000 Marketing and administrative costs Marketing (variable, cash) 422,400 Marketing depreciation 149,600 Administrative (fixed, cash) 509,200 Administrative depreciation 74,800 Total costs $ 2,793,000 Operating profits $ 57,000 All depreciation charges are fixed and are expected to remain the same for year 2. Sales volume is expected...
 The following information is available for year 1 for Pepper
Products:
Sales revenue (210,000 units)
$
3,150,000
Manufacturing costs
Materials
$
168,000
Variable cash costs
142,400
Fixed cash costs
327,600
Depreciation (fixed)
989,000
Marketing and administrative costs
Marketing (variable, cash)
422,400
Marketing depreciation
159,600
Administrative (fixed, cash)
509,200
Administrative depreciation
84,800
Total costs
$
2,803,000
Operating profits
$
347,000
All depreciation charges are fixed and are expected to remain the
same for year 2. Sales volume is expected...
The following information is available for year 1 for Pepper
Products:
Sales revenue (210,000 units)
$
3,150,000
Manufacturing costs
Materials
$
168,000
Variable cash costs
142,400
Fixed cash costs
327,600
Depreciation (fixed)
989,000
Marketing and administrative costs
Marketing (variable, cash)
422,400
Marketing depreciation
159,600
Administrative (fixed, cash)
509,200
Administrative depreciation
84,800
Total costs
$
2,803,000
Operating profits
$
347,000
All depreciation charges are fixed and are expected to remain the
same for year 2. Sales volume is expected...
 The following information is available for year 1 for Pepper
Products:
Sales revenue (240,000 units)
$
3,840,000
Manufacturing costs
Materials
$
226,000
Variable cash costs
192,000
Fixed cash costs
442,000
Depreciation (fixed)
1,348,000
Marketing and administrative costs
Marketing (variable, cash)
570,000
Marketing depreciation
202,000
Administrative (fixed, cash)
687,000
Administrative depreciation
101,000
Total costs
$
3,768,000
Operating profits
$
72,000
All depreciation charges are fixed and are expected to remain the
same for year 2. Sales volume is expected...
The following information is available for year 1 for Pepper
Products:
Sales revenue (240,000 units)
$
3,840,000
Manufacturing costs
Materials
$
226,000
Variable cash costs
192,000
Fixed cash costs
442,000
Depreciation (fixed)
1,348,000
Marketing and administrative costs
Marketing (variable, cash)
570,000
Marketing depreciation
202,000
Administrative (fixed, cash)
687,000
Administrative depreciation
101,000
Total costs
$
3,768,000
Operating profits
$
72,000
All depreciation charges are fixed and are expected to remain the
same for year 2. Sales volume is expected...
 Question 9 10. Thanks for your help
9. Given the following information, find fixed costs: a. Total sales, $104,672 profit, $18.000; variable rate, 42 h Profit, $12.000: number of customers, 32392; variable cost per unit. c. Sales price per unit, $1460; profit, $34,000, number of customers. price per unit, $18.40: number of custom- $4.63; sales price per unit, $10.34 26,712; variable rate, 35 ers, 26,549: profit, $33,000 d. Contribution rate, 65; sales 10. Given the following information, find profit xed...
Question 9 10. Thanks for your help
9. Given the following information, find fixed costs: a. Total sales, $104,672 profit, $18.000; variable rate, 42 h Profit, $12.000: number of customers, 32392; variable cost per unit. c. Sales price per unit, $1460; profit, $34,000, number of customers. price per unit, $18.40: number of custom- $4.63; sales price per unit, $10.34 26,712; variable rate, 35 ers, 26,549: profit, $33,000 d. Contribution rate, 65; sales 10. Given the following information, find profit xed...
 24-12. Cost-volume-profit analysis. Three cor.panies are each producing and selling annually 10,000 units of a similar product at a unit sales price of $10. The companies have fixed and var able costs as follows: COMPANY FIxED CoST $20,000 40.000 60,000 VARIABLE COST PER UNIT $6 Each company contemplates a price cut, from $10 to $8, in the expectation that sales w increase from 10,000 to 15,000 units per year Required (1) The contribution margin and operating income for each company...
Most questions answered within 3 hours.
-
Write the ionic equations for the first stage of salts
hydrolysis.
Anion, Cation?
Na2S
NiSO4
K2SO4...
asked 3 minutes ago -
suppose there is a normally distributed population with a mean of
250 and a standard deviation...
asked 47 minutes ago -
Question Three
Suppose you as project manager are using the Waterfall
development methodology on a large...
asked 1 hour ago -
Which statement is not true about welfare in Canada?
A.Benefits typically vary based on one's ability...
asked 2 hours ago -
Please help me with FLOWCHART and UML diagram for class,
thank you!
#include <iostream>
#include <fstream>...
asked 3 hours ago -
3. Describe the “logic circuit” of the Lac operon. Which
proteins are bound or not to...
asked 3 hours ago -
Ayesha’s adjusted gross income is $60,000 in 2019. She donated a
piece of artwork with a...
asked 3 hours ago -
For Dijkstra’s shortest path algorithm:
a. Give the Big-O time for Dijkstra’s shortest path algorithm
and...
asked 3 hours ago -
Phosphorus violates the 'octet rule' in biological molecules,
forming more covalent bonds than expected based on...
asked 3 hours ago -
A 1.3 eV electron has a 10-4 probability of tunneling
through a 2.4 eV potential barrier....
asked 3 hours ago -
What is the one ingredient that is common to being successful
with all stakeholders?
profit
trust...
asked 3 hours ago -
Write an assembly language 32 bit program that reads in lines of
text by a .txt...
asked 3 hours ago