Someone plz plz help with this Statistics Intro to R programming question!!!
Here are the examples and follow by my question!!
Thank you so much!! I appreciate it


!!!!My question!!!!
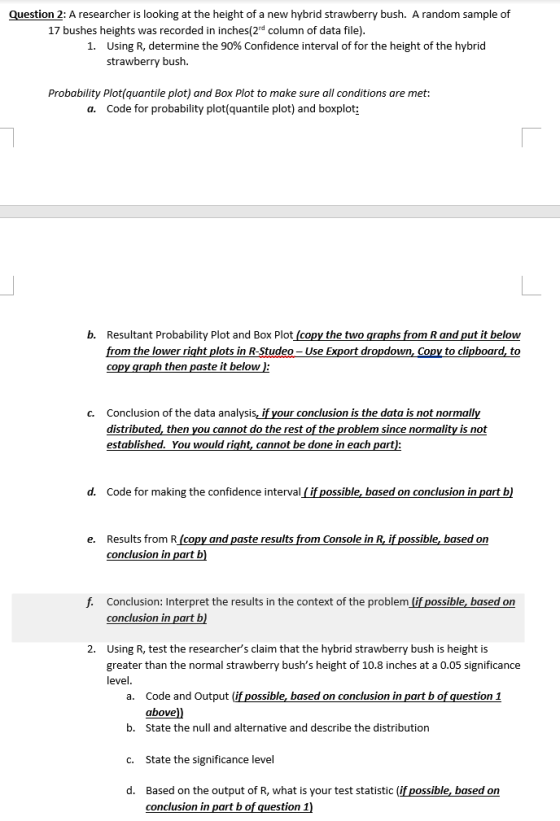


0 8 70 75 80 85 90 Degrees Farenheit Conclusion of Data Analysis Based on the probability plot there does not seem to be any deviation from normality. Further, the boxplot indicates there are no outliers. Therefore, it is reasonable to assume that this sample of temperatures came from a population that is normally distributed. 90% confidence interval: Code: #Fastest way to get a confidence interval (90% CI in this example), but you will get extra information, disregard cantlevel 0.90)
Results: From the Console copy and paste the output generated from the previous command) One Sample t-test data: CricketssTeme. t46.217, df 14, p-value
Homework Answers
Solution(2)
(1)
Rcode:
strawberry <-
c(11.4,10.6,11.3,11.6,11,10.9,10.8,11.1,11,10.8,11.4,11.4,11.2,10.5,10.7,10.9,10.7)
print(strawberry)
t.test(strawberry,conf.level = 0.90)
90 percent confidence interval lies in between
10.88106 and 11.15423
Solution2a:
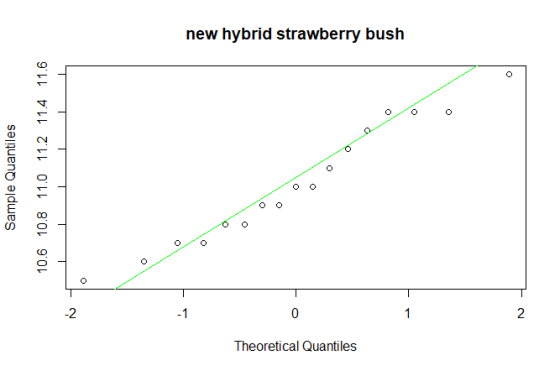
qqnorm(strawberry,main="new hybrid strawberry bush")
qqline(strawberry,col="green")
boxplot(strawberry,main="new hybrid strawberry
bush",horizontal=TRUE,xlab="In inches",col="green")
Solution2b:

Solution2c:
no outliers found from boxplot .
Form qqplot data does not deviate from normal distribution.
Therefore the sample is taken from population that is normally distributed.
Solution2d:
strawberry <-
c(11.4,10.6,11.3,11.6,11,10.9,10.8,11.1,11,10.8,11.4,11.4,11.2,10.5,10.7,10.9,10.7)
print(strawberry)
t.test(strawberry,conf.level = 0.90)
Add Answer to:
Someone plz plz help with this Statistics Intro to R programming question!!! Here are the examples and follow by my question!! Thank you so much!! I appreciate it !!!!My question!!!! Question T...
thank you for all the help! i appreciate everythjng! 1 2 3 (1 point) A random...
 thank you for all the help! i appreciate everythjng!
1
2
3
(1 point) A random sample of 100 observations from a population with standard deviation 8.31 yielded a sample mean of 91.5. Part 1: Part 2: Part 3: Given that the null hypothesis is j = 90 and the alternative hypothesis is #90 using a = .05, find the following: (a) Test statistic = (b) P-value: Note: Round off the test statistic to 2 decimal places and the P-value...
thank you for all the help! i appreciate everythjng!
1
2
3
(1 point) A random sample of 100 observations from a population with standard deviation 8.31 yielded a sample mean of 91.5. Part 1: Part 2: Part 3: Given that the null hypothesis is j = 90 and the alternative hypothesis is #90 using a = .05, find the following: (a) Test statistic = (b) P-value: Note: Round off the test statistic to 2 decimal places and the P-value...
i've been having a hard time, i appreciate your help, thank you so much in advance!...
 i've been having a hard time, i appreciate your help, thank
you so much in advance! can you please circle the answers thank
you
1
2
3
(1 point) It is necessary for an automobile producer to estimate the number of miles per gallon achieved by its cars. Suppose that the sample mean for a random sample of 150 cars is 29.1 miles and assume the standard deviation is 2.4 miles. Now suppose the car producer wants to test the...
i've been having a hard time, i appreciate your help, thank
you so much in advance! can you please circle the answers thank
you
1
2
3
(1 point) It is necessary for an automobile producer to estimate the number of miles per gallon achieved by its cars. Suppose that the sample mean for a random sample of 150 cars is 29.1 miles and assume the standard deviation is 2.4 miles. Now suppose the car producer wants to test the...
im so grateful for all the help! thank you in advance !! this means so much...
 im so grateful for all the help! thank you in advance !! this
means so much to me you havw no idea
1
2
3
4
At least one of the answers above is NOT correct. (1 point) (a) Find the P-value for the test statistic z = -1.32 for the following null and alternative hypotheses: Ho: The population mean is 18. H : The population mean is less than 18. The P-value is 0.000347 (b) Find the P-value for...
im so grateful for all the help! thank you in advance !! this
means so much to me you havw no idea
1
2
3
4
At least one of the answers above is NOT correct. (1 point) (a) Find the P-value for the test statistic z = -1.32 for the following null and alternative hypotheses: Ho: The population mean is 18. H : The population mean is less than 18. The P-value is 0.000347 (b) Find the P-value for...
Hello if someone could help me with this multi part probably for the statistics? Thank you!...
Hello if someone could help me with this multi part probably for the statistics? Thank you! Question 32q: A researcher is comparing two different weight-loss drugs. She splits her study participants into two halves randomly; every day for a month, one half (Group 1) takes Drug 1, and the other half (Group 2) takes Drug 2. She measures the total weight loss, in pounds, of each participant. A) Total Weight Loss of Each Participant at the end of the study...
Please help me with my whole assigment 1. [7 marks in total] A statistics practitioner took...
 Please help me with my whole assigment
1. [7 marks in total] A statistics practitioner took a random sample of 31 observations from a normal population. The sample standard deviation is 34 and the sample mean is 97. Note: For each confidence interval, enter your answer in the form (LCL", UCL"). You must include the parentheses and the comma between the confidence limits. A. Estimate the population mean with 95% confidence. Diagram Confidence interval B. Estimate the population mean with...
Please help me with my whole assigment
1. [7 marks in total] A statistics practitioner took a random sample of 31 observations from a normal population. The sample standard deviation is 34 and the sample mean is 97. Note: For each confidence interval, enter your answer in the form (LCL", UCL"). You must include the parentheses and the comma between the confidence limits. A. Estimate the population mean with 95% confidence. Diagram Confidence interval B. Estimate the population mean with...
Question 1 to 11, True or False? Applied business statistics 1) The width of the confidence...
 Question 1 to 11, True or False? Applied business statistics
1) The width of the confidence interval depends only on the desired level of confidence 2) When population standard deviation is unknown, sample standaird deviation is used and the interval estimation is based on values from the t- rather than the z-distribution n 3) The z value for a 98% confidence interval around the point estimate is 2.33 4) In order to construct a 90% confidence interval for the population...
Question 1 to 11, True or False? Applied business statistics
1) The width of the confidence interval depends only on the desired level of confidence 2) When population standard deviation is unknown, sample standaird deviation is used and the interval estimation is based on values from the t- rather than the z-distribution n 3) The z value for a 98% confidence interval around the point estimate is 2.33 4) In order to construct a 90% confidence interval for the population...
i appreciate all the help! thank you so much 1 2 Entered Answer Preview Result -0.05...
 i appreciate all the help! thank you so much
1
2
Entered Answer Preview Result -0.05 -0.05 incorrect -1.9599 -1.9599 correct -3.0619 -3.0619 correct B B correct At least one of the answers above is NOT correct. (1 point) it is necessary for an automobile producer to estimate the number of miles per gallon achieved by its cars. Suppose that the sample mean for a random sample of 150 cars is 29.1 miles and assume the standard deviation is 2.4...
i appreciate all the help! thank you so much
1
2
Entered Answer Preview Result -0.05 -0.05 incorrect -1.9599 -1.9599 correct -3.0619 -3.0619 correct B B correct At least one of the answers above is NOT correct. (1 point) it is necessary for an automobile producer to estimate the number of miles per gallon achieved by its cars. Suppose that the sample mean for a random sample of 150 cars is 29.1 miles and assume the standard deviation is 2.4...
need help, work shown would be so helpful so i can understand and please box answer clearly if you can!!! either way thank you so much in advance:) s. You are interested in whether a treatment ca...
 need help, work shown would be so helpful so i can understand
and please box answer clearly if you can!!! either way thank you so
much in advance:)
s. You are interested in whether a treatment causes an effect on a continuously measurable attribute. You use a treatment group with 7 cases and a control group with 7 cases. You decide to run a hypothesis test with a significance level of 0.01. Your data is below. Please use 10 for...
need help, work shown would be so helpful so i can understand
and please box answer clearly if you can!!! either way thank you so
much in advance:)
s. You are interested in whether a treatment causes an effect on a continuously measurable attribute. You use a treatment group with 7 cases and a control group with 7 cases. You decide to run a hypothesis test with a significance level of 0.01. Your data is below. Please use 10 for...
Do not use MS Excel or statistics software unless stated otherwise (1 -2) (Confidence Interval) T...
 Do not use MS Excel or statistics software unless stated otherwise (1 -2) (Confidence Interval) The following sample data are measurements of weight of middle school students. 153,148, 151, 163, 114,164, 135, 131,176 (25%) Assume that we do not know the true standard deviation of middle school students Calculate the two-sided 95% confidence intervals on the mean (find both upper and lower limits). I. 2. (25%) Assume now that we know the standard deviation of all middle school students is...
thank you for helping me, i appreciate this so much, you are amazing !! Entered Answer...
 thank you for helping me, i appreciate this so much, you are
amazing !!
Entered Answer Preview Result 3.2498 3.2498 correct 3.94623 3.94623 incorrect At least one of the answers above is NOT correct. (1 point) A random sample of 10 size AA batteries for toys yield a mean of 3.84 hours with standard deviation, 1.2 hours. (a) Find the critical value, r*, for a 99% confidence interval.rº 3.2498 (b) Find the margin of error for a 99% confidence interval....
thank you for helping me, i appreciate this so much, you are
amazing !!
Entered Answer Preview Result 3.2498 3.2498 correct 3.94623 3.94623 incorrect At least one of the answers above is NOT correct. (1 point) A random sample of 10 size AA batteries for toys yield a mean of 3.84 hours with standard deviation, 1.2 hours. (a) Find the critical value, r*, for a 99% confidence interval.rº 3.2498 (b) Find the margin of error for a 99% confidence interval....
 thank you for all the help! i appreciate everythjng!
1
2
3
(1 point) A random sample of 100 observations from a population with standard deviation 8.31 yielded a sample mean of 91.5. Part 1: Part 2: Part 3: Given that the null hypothesis is j = 90 and the alternative hypothesis is #90 using a = .05, find the following: (a) Test statistic = (b) P-value: Note: Round off the test statistic to 2 decimal places and the P-value...
thank you for all the help! i appreciate everythjng!
1
2
3
(1 point) A random sample of 100 observations from a population with standard deviation 8.31 yielded a sample mean of 91.5. Part 1: Part 2: Part 3: Given that the null hypothesis is j = 90 and the alternative hypothesis is #90 using a = .05, find the following: (a) Test statistic = (b) P-value: Note: Round off the test statistic to 2 decimal places and the P-value...
 i've been having a hard time, i appreciate your help, thank
you so much in advance! can you please circle the answers thank
you
1
2
3
(1 point) It is necessary for an automobile producer to estimate the number of miles per gallon achieved by its cars. Suppose that the sample mean for a random sample of 150 cars is 29.1 miles and assume the standard deviation is 2.4 miles. Now suppose the car producer wants to test the...
i've been having a hard time, i appreciate your help, thank
you so much in advance! can you please circle the answers thank
you
1
2
3
(1 point) It is necessary for an automobile producer to estimate the number of miles per gallon achieved by its cars. Suppose that the sample mean for a random sample of 150 cars is 29.1 miles and assume the standard deviation is 2.4 miles. Now suppose the car producer wants to test the...
 im so grateful for all the help! thank you in advance !! this
means so much to me you havw no idea
1
2
3
4
At least one of the answers above is NOT correct. (1 point) (a) Find the P-value for the test statistic z = -1.32 for the following null and alternative hypotheses: Ho: The population mean is 18. H : The population mean is less than 18. The P-value is 0.000347 (b) Find the P-value for...
im so grateful for all the help! thank you in advance !! this
means so much to me you havw no idea
1
2
3
4
At least one of the answers above is NOT correct. (1 point) (a) Find the P-value for the test statistic z = -1.32 for the following null and alternative hypotheses: Ho: The population mean is 18. H : The population mean is less than 18. The P-value is 0.000347 (b) Find the P-value for...
 Please help me with my whole assigment
1. [7 marks in total] A statistics practitioner took a random sample of 31 observations from a normal population. The sample standard deviation is 34 and the sample mean is 97. Note: For each confidence interval, enter your answer in the form (LCL", UCL"). You must include the parentheses and the comma between the confidence limits. A. Estimate the population mean with 95% confidence. Diagram Confidence interval B. Estimate the population mean with...
Please help me with my whole assigment
1. [7 marks in total] A statistics practitioner took a random sample of 31 observations from a normal population. The sample standard deviation is 34 and the sample mean is 97. Note: For each confidence interval, enter your answer in the form (LCL", UCL"). You must include the parentheses and the comma between the confidence limits. A. Estimate the population mean with 95% confidence. Diagram Confidence interval B. Estimate the population mean with...
 Question 1 to 11, True or False? Applied business statistics
1) The width of the confidence interval depends only on the desired level of confidence 2) When population standard deviation is unknown, sample standaird deviation is used and the interval estimation is based on values from the t- rather than the z-distribution n 3) The z value for a 98% confidence interval around the point estimate is 2.33 4) In order to construct a 90% confidence interval for the population...
Question 1 to 11, True or False? Applied business statistics
1) The width of the confidence interval depends only on the desired level of confidence 2) When population standard deviation is unknown, sample standaird deviation is used and the interval estimation is based on values from the t- rather than the z-distribution n 3) The z value for a 98% confidence interval around the point estimate is 2.33 4) In order to construct a 90% confidence interval for the population...
 i appreciate all the help! thank you so much
1
2
Entered Answer Preview Result -0.05 -0.05 incorrect -1.9599 -1.9599 correct -3.0619 -3.0619 correct B B correct At least one of the answers above is NOT correct. (1 point) it is necessary for an automobile producer to estimate the number of miles per gallon achieved by its cars. Suppose that the sample mean for a random sample of 150 cars is 29.1 miles and assume the standard deviation is 2.4...
i appreciate all the help! thank you so much
1
2
Entered Answer Preview Result -0.05 -0.05 incorrect -1.9599 -1.9599 correct -3.0619 -3.0619 correct B B correct At least one of the answers above is NOT correct. (1 point) it is necessary for an automobile producer to estimate the number of miles per gallon achieved by its cars. Suppose that the sample mean for a random sample of 150 cars is 29.1 miles and assume the standard deviation is 2.4...
 need help, work shown would be so helpful so i can understand
and please box answer clearly if you can!!! either way thank you so
much in advance:)
s. You are interested in whether a treatment causes an effect on a continuously measurable attribute. You use a treatment group with 7 cases and a control group with 7 cases. You decide to run a hypothesis test with a significance level of 0.01. Your data is below. Please use 10 for...
need help, work shown would be so helpful so i can understand
and please box answer clearly if you can!!! either way thank you so
much in advance:)
s. You are interested in whether a treatment causes an effect on a continuously measurable attribute. You use a treatment group with 7 cases and a control group with 7 cases. You decide to run a hypothesis test with a significance level of 0.01. Your data is below. Please use 10 for...
 Do not use MS Excel or statistics software unless stated otherwise (1 -2) (Confidence Interval) The following sample data are measurements of weight of middle school students. 153,148, 151, 163, 114,164, 135, 131,176 (25%) Assume that we do not know the true standard deviation of middle school students Calculate the two-sided 95% confidence intervals on the mean (find both upper and lower limits). I. 2. (25%) Assume now that we know the standard deviation of all middle school students is...
 thank you for helping me, i appreciate this so much, you are
amazing !!
Entered Answer Preview Result 3.2498 3.2498 correct 3.94623 3.94623 incorrect At least one of the answers above is NOT correct. (1 point) A random sample of 10 size AA batteries for toys yield a mean of 3.84 hours with standard deviation, 1.2 hours. (a) Find the critical value, r*, for a 99% confidence interval.rº 3.2498 (b) Find the margin of error for a 99% confidence interval....
thank you for helping me, i appreciate this so much, you are
amazing !!
Entered Answer Preview Result 3.2498 3.2498 correct 3.94623 3.94623 incorrect At least one of the answers above is NOT correct. (1 point) A random sample of 10 size AA batteries for toys yield a mean of 3.84 hours with standard deviation, 1.2 hours. (a) Find the critical value, r*, for a 99% confidence interval.rº 3.2498 (b) Find the margin of error for a 99% confidence interval....
Most questions answered within 3 hours.
-
Write a program that reads in a text file, infile.txt, and
prints out all the lines...
asked 39 minutes ago -
Which of the following orbits have a total of zero energy (based
on the common convention)?...
asked 47 minutes ago -
Find the expected count and the contribution to the chi-square
statistic for the (Group 1, No)...
asked 2 hours ago -
Suppose you are purchasing a meal and with every meal a you
receive one of 10...
asked 2 hours ago -
A 75.0 kg 0erson is riding in a car moving at 20.0 m/s when the
car...
asked 2 hours ago -
What does Δp = QR mean in words?
Pushing a viscous fluid through a pipe requires...
asked 2 hours ago -
We know that system.out.println (“object number” + n ); is
legal.String name; int n; name =...
asked 2 hours ago -
Come up with a real-life problem (open-ended) and solve it by
designing and writing a Java...
asked 2 hours ago -
Power Music owns five music stores, where it sells music,
instruments, and supplies. In addition, it...
asked 2 hours ago -
True or false and
why:
Given the following sequence of numbers to be
inserted {4,5,6,1,2,3,8,7}, the...
asked 2 hours ago -
Code using Java
What is an interface? Complete the following code:
interface IExample{
public void print();...
asked 2 hours ago -
Bob Nale is the owner of Nale’s Quick Fill. Bob would like to
estimate the mean...
asked 3 hours ago