
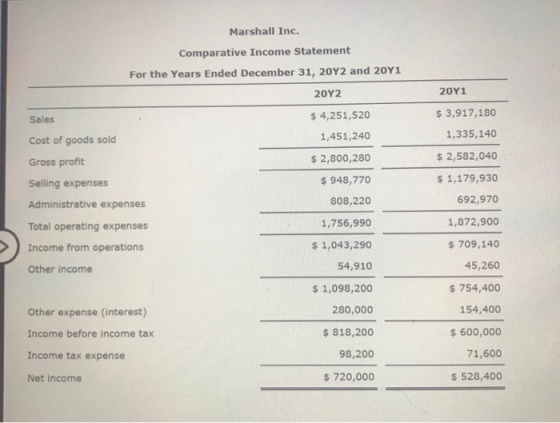


Marshall Inc. Comparative Income Statement For the Years Ended December 31, 20Y2 and 20Y1 20Y1 20Y2 $ 3,917,180 $4,251,520 Sales 1,335,140 1,451,240 Cost of goods sold $2,582,040 $ 2,800,280 Gross profit $1,179,930 948,770 Selling expenses 692,970 808,220 Administrative expenses 1,872,900 1,756,990 Total operating expenses $709,140 $ 1,043,290 Income from operations 45,260 54,910 Other income $ 1,098,200 $ 754,400 154,400 280,000 Other expense (interest) 600,000 $818,200 Income before income tax 98,200 71,600 Income tax expense s720,000 $528,400 Net income
Comparative Balance Sheet December 31, 20Y2 and 20Y1 Dec. 31, 20Y1 Dec. 31, 20Y2 Assets Current assets $699,480 s 787,110 Cash 1,159,140 Marketable securities 1,191,300 737,300 Accounts receivable (net) 781,100 452,600 584,000 Inventories 139,900 148,904 Prepaid expenses s 3,492,414 $3,188,420 Total current assets 2,074,821 808,205 Long-term investments 3,780,000 4,200,000 Property, plant, and equipment (net) $ 9,767,235 $7,776,625 Total assets Liabilities $1,126,585 $1,387,275 Current liabilities Long-term liabilities $1,570,000 Mortgage note payable, 8 % $ 0 1,930,000 1,930,000 Bonds payable, 8 % $3,500,000 Total long-term liabilities $1,930,000
Liabilities Current liabilities $1,126,585 s 1,387,275 Long-term liabilities Mortgage note payable, 8 % s 0 $1,570,000 Bonds payable, 8 % 1,930,000 1,930,000 Total long-term liabilities 3,500,000 $1,930,000 Total liabilities $4,626,585 $3,317,275 Stockholders' Equity Preferred $ 0.70 stock, $50 par s 650,000 650,000 Common stock, $ 10 par 740,000 740,000 Retained earnings 3,750,650 3,069,350 Total stockholders' equity $5,140,650 4,459,350 Total liabilities and stockholders' equity $9,767,235 7,776,625 Required: ing measures for 20Y2, rounding to one decimal place, except for dollar amounts, which sho requirement for subsequent requirement, if required. Assume 365 days a year. 1. Working capital 2,365,829 2. Current ratio 3.1 3. Quick ratio 2.4 V
2. Current ratio 3.1 3. Quick ratio 2.4 4. Accounts receivable turnover 5.6 v Number of days' sales in receivables 5. 65.2 days 6. Inventory turnover 2.8V Number of days' sales in inventory 7. 130.4 days Ratio of fixed assets to long-term liabilities 8. 1.2 Ratio of liabilities to stockholders' equity 9. 0.9 10. Times interest earned 11. Asset turnover 0.6 12. Return on total assets 13. Return on stockholders' equity 14. Return on common stockholders' equity 15. Earnings per share on common stock 16. Price-earnings ratio 17. Dividends per share of common stock 18. Dividend yield
Homework Answers
| Please hit LIKE button if this helped. For any further explanation, please put your query in comment, will get back to you. | ||||
| 10. Times Interest Earned | ||||
| Net Operating Income (EBIT) | a | $ 1,098,200 | ||
| Interst Expense | b | $ 280,000 | ||
| Times Interest Earned | a/b | 3.92 | ||
| 12. Return on Total Assets | ||||
| Net Income | a | $ 720,000 | ||
| Total Average Assets ($9,767,235+$7,776,625)/2 | b | $ 8,771,930 | ||
| a/b | 8.21% | |||
| 13. Return on Stockholde Equity | ||||
| Net Income | a | $ 720,000 | ||
| Average Equity ($5,140,650+$4,459,350)/2 | b | $ 4,800,000 | ||
| a/b | 15.00% | |||
| 14. Return on Common Stockholder's Equity | ||||
| Net Income | a | $ 720,000 | ||
| Average Common Equity | b | $ 4,150,000 | ||
| a/b | 17.35% | |||
| Year 2 | Year 1 | Average | ||
| Common Stock | $ 740,000 | $ 740,000 | ||
| Retained Earning | $3,750,650 | $ 3,069,350 | ||
| Total | $4,490,650 | $ 3,809,350 | $4,150,000 | |
| 15. Earning per share on Common Stock | ||||
| Net Income available for Common Stockholders ($720,000-$9,100 | a | $ 710,900 | ||
| No of Shares outstanding | b | 74,000 | ||
| a/b | $ 9.61 | |||
| 16. Price Earning Ratio | ||||
| Earning per Share | a | $ 9.61 | ||
| Market Price | b | Not Given | ||
| b/a | #VALUE! | |||
| 17. Dividend per share of Common Stock | ||||
| Dividend on Common Stock | a | $ 29,600 | ||
| No of Shares outstanding | b | 74,000 | ||
| a/b | $ 0.40 | |||
| 18. Dividend Yield | ||||
| Annual Dividend | a | $ 29,600 | ||
| Market Price of Stock | b | Not Given | ||
| b/a | #VALUE! | |||
Add Answer to:
Measures of liquidity, Solvency and Profitability The comparative financial statements of Marshall Inc. are as follows. The market price of Marshall Inc. common st Marshall Inc. Comparative R...
Measures of liquidity, Solvency and Profitability The comparative financial statements of Marshall Inc. are as follows. The market...
Measures of liquidity, Solvency and Profitability The comparative financial statements of Marshall Inc. are as follows. The market price of Marshall Inc. common stock was $ 68 on December 31, 20Y2. Marshall Inc. Comparative Retained Earnings Statement For the Years Ended December 31, 20Y2 and 20Y1 20Y2 20Y1 Retained earnings, January 1 $ 1,407,900 $ 1,190,000 Net income 330,000 243,700 Total $ 1,737,900 $ 1,433,700 Dividends On preferred stock $ 10,500 $ 10,500 On common stock 15,300 15,300 Total dividends $ 25,800...
Measures of liquidity, Solvency and Profitability The comparative financial statements of Marshall Inc. are as follows....
Measures of liquidity, Solvency and Profitability The comparative financial statements of Marshall Inc. are as follows. The market price of Marshall Inc. common stock was $ 59 on December 31, 20Y2. Marshall Inc. Comparative Retained Earnings Statement For the Years Ended December 31, 20Y2 and 20Y1 20Y2 20Y1 Retained earnings, January 1 $ 1,659,275 $ 1,404,525 Net income 374,400 287,700 Total $ 2,033,675 $ 1,692,225 Dividends On preferred stock $ 6,300 $ 6,300 On common stock 26,650 26,650 Total dividends...
Measures of liquidity, Solvency and Profitability The comparative financial statements of Marshall Inc. are as follows....
Measures of liquidity, Solvency and Profitability The comparative financial statements of Marshall Inc. are as follows. The market price of Marshall common stock was $ 62 on December 31, 20Y2. Marshall Inc. Comparative Retained Earnings Statement For the Years Ended December 31, 20Y2 and 20Y1 20Y2 20Y1 Retained earnings, January 1 $ 2,842,400 $ 2,417,000 Net income 624,800 495,000 Total $3,467,200 $ 2,912,000 Dividends: On preferred stock $ 8,400 $ 8,400 On common stock 61,200 61,200 Total dividends $ 69,600...
Measures of liquidity, Solvency and Profitability The comparative financial statements of Marshall Inc. are as follows....
 Measures of liquidity, Solvency and Profitability The comparative financial statements of Marshall Inc. are as follows. The market price of Marshall Inc. common stock was $ 68 on December 31, 20Y2. Marshall Inc. Comparative Retained Earnings Statement For the Years Ended December 31, 20Y2 and 20Y1 2012 20Y1 Retained earnings, January 1 $ 1,190,000 $ 1,407,900 330,000 Net income 243,700 Total $ 1,737,900 $ 1,433,700 Dividends $ 10,500 $ 10,500 15,300 15,300 On preferred stock On common stock Total dividends...
Measures of liquidity, Solvency, and Profitability The comparative financial statements of Marshall Inc. are as follows....
Measures of liquidity, Solvency, and Profitability The comparative financial statements of Marshall Inc. are as follows. The market price of Marshall common stock was $ 63 on December 31, 20Y2. Marshall Inc. Comparative Retained Earnings Statement For the Years Ended December 31, 20Y2 and 20Y1 20Y2 20Y1 Retained earnings, January 1 $1,022,050 $862,950 Net income 233,600 176,800 Total $1,255,650 $1,039,750 Dividends: On preferred stock $7,700 $7,700 On common stock 10,000 10,000 Total dividends $17,700 $17,700 Retained earnings, December 31 $1,237,950...
Measures of liquidity, Solvency, and Profitability The comparative financial statements of Marshall Inc. are as follows....
Measures of liquidity, Solvency, and Profitability The comparative financial statements of Marshall Inc. are as follows. The market price of Marshall common stock was $ 58 on December 31, 20Y2. Marshall Inc. Comparative Retained Earnings Statement For the Years Ended December 31, 20Y2 and 20Y1 20Y2 20Y1 Retained earnings, January 1 $1,802,125 $1,537,175 Net income 425,600 314,800 Total $2,227,725 $1,851,975 Dividends: On preferred stock $13,300 $13,300 On common stock 36,550 36,550 Total dividends $49,850 $49,850 Retained earnings, December 31 $2,177,875...
Measures of liquidity, Solvency, and Profitability The comparative financial statements of Marshall Inc. are as follows....
Measures of liquidity, Solvency, and Profitability The comparative financial statements of Marshall Inc. are as follows. The market price of Marshall common stock was $ 56 on December 31, 20Y2. Marshall Inc. Comparative Retained Earnings Statement For the Years Ended December 31, 20Y2 and 20Y1 20Y2 20Y1 Retained earnings, January 1 $1,793,525 $1,515,775 Net income 425,600 310,400 Total $2,219,125 $1,826,175 Dividends: On preferred stock $13,300 $13,300 On common stock 19,350 19,350 Total dividends $32,650 $32,650 Retained earnings, December 31 $2,186,475...
Measures of liquidity, Solvency, and Profitability The comparative financial statements of Marshall Inc. are as follows....
Measures of liquidity, Solvency, and Profitability The comparative financial statements of Marshall Inc. are as follows. The market price of Marshall common stock was $ 63 on December 31, 20Y2. Marshall Inc. Comparative Retained Earnings Statement For the Years Ended December 31, 20Y2 and 20Y1 20Y2 20Y1 Retained earnings, January 1 $1,315,800 $1,118,300 Net income 280,000 229,100 Total $1,595,800 $1,347,400 Dividends: On preferred stock $9,100 $9,100 On common stock 22,500 22,500 Total dividends $31,600 $31,600 Retained earnings, December 31 $1,564,200...
Measures of liquidity, Solvency, and Profitability The comparative financial statements of Marshall Inc. are as follows....
Measures of liquidity, Solvency, and Profitability The comparative financial statements of Marshall Inc. are as follows. The market price of Marshall common stock was $ 56 on December 31, 20Y2. Marshall Inc. Comparative Retained Earnings Statement For the Years Ended December 31, 20Y2 and 20Y1 20Y2 20Y1 Retained earnings, January 1 $2,715,500 $2,304,500 Net income 630,000 472,000 Total $3,345,500 $2,776,500 Dividends: On preferred stock $9,800 $9,800 On common stock 51,200 51,200 Total dividends $61,000 $61,000 Retained earnings, December 31 $3,284,500...
 Measures of liquidity, Solvency and Profitability The comparative financial statements of Marshall Inc. are as follows. The market price of Marshall Inc. common stock was $ 68 on December 31, 20Y2. Marshall Inc. Comparative Retained Earnings Statement For the Years Ended December 31, 20Y2 and 20Y1 2012 20Y1 Retained earnings, January 1 $ 1,190,000 $ 1,407,900 330,000 Net income 243,700 Total $ 1,737,900 $ 1,433,700 Dividends $ 10,500 $ 10,500 15,300 15,300 On preferred stock On common stock Total dividends...
 Measures of liquidity, Solvency and Profitability The comparative financial statements of Marshall Inc. are as follows. The market price of Marshall Inc. common stock was $ 68 on December 31, 20Y2. Marshall Inc. Comparative Retained Earnings Statement For the Years Ended December 31, 20Y2 and 20Y1 2012 20Y1 Retained earnings, January 1 $ 1,190,000 $ 1,407,900 330,000 Net income 243,700 Total $ 1,737,900 $ 1,433,700 Dividends $ 10,500 $ 10,500 15,300 15,300 On preferred stock On common stock Total dividends...
Most questions answered within 3 hours.
-
Write the mechanism for the reaction involving [emim][Br] and
lithium bis(trifluoromethylsulfonyl)imide.
asked 7 minutes ago -
The half life of a specific Tc-99m is 6 hours. How much of an
192 mg...
asked 15 minutes ago -
If you have 35.0g of Na and 100.0g of Cl2, what is the
maximum amount of...
asked 18 minutes ago -
Assume that adults have IQ scores that are normally distributed
with a mean of 96.8 and...
asked 18 minutes ago -
If a product or other segment of a business is generating a
loss, it is erroneous...
asked 21 minutes ago -
I need help writing c++ code to make this program.
1. Define a function that can...
asked 22 minutes ago -
Problem #5
A communications cable is 2.00 km long and consists of two
parallel wires separated...
asked 50 minutes ago -
Cranium, Inc., purchases term papers from an overseas supplier
under a continuous review system. The average...
asked 4 hours ago -
1- What is the freezing point of pure water (in degrees
Celsius)?
2-
he molar mass...
asked 4 hours ago -
Determine the direction of the force that will act on the charge
in each of the...
asked 4 hours ago -
You purchase your daily coffee at the Chemist’s Coffeehouse and
have a choice of two cups:...
asked 7 hours ago -
Which of the following pairs of chemicals could be used to make
a buffer solution?
A.)...
asked 7 hours ago