
Homework Answers


%%Matlab code for plotting the data and model
clear all
close all
%all data
tt=0:0.25:2.0;
vv=[0 3.3 4.8 5.5 5.9 6.1 6.1 6.1 6.1];
%model for velocity
v=@(t) 6.1.*(1-exp(-3*t));
%plotting the data
hold on
plot(tt,vv,'r*','linewidth',2)
plot(tt,v(tt))
xlabel('time in sec')
ylabel('Velocity in m/sec')
title('Time vs. Velocity plot')
legend('Actual data','Model data')
box on
grid on
%%%%%%%%%%%%%%% End of Code %%%%%%%%%%%%
Add Answer to:
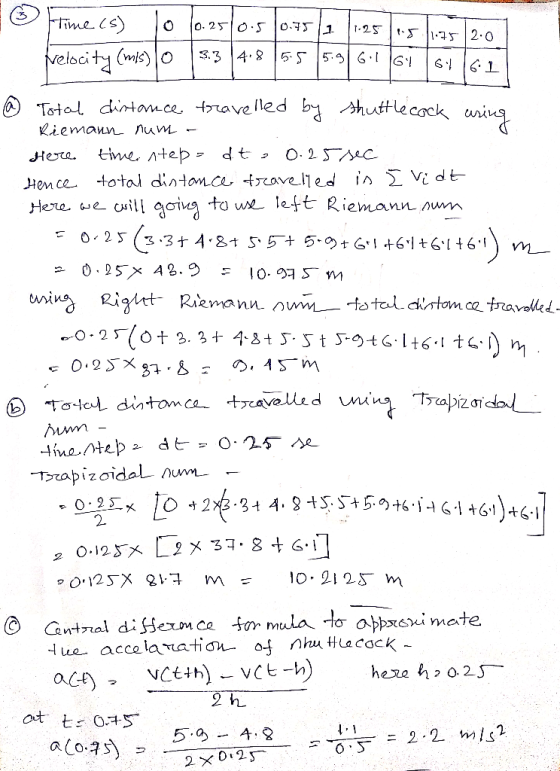
3. (10 marks) Suppose you measured the speed of a shuttlecock falling, and got the following data points time (s) v...
6. [10 points) For the following question, to model the free fall of a falling rock,...
 6. [10 points) For the following question, to model the free fall of a falling rock, assume the usual idealizing simplifications for solving "free fall" problems. Work with the approximate value g = 9.8 m/s2 for the Earth's gravitational acceleration. Consider the following experiment. The Leaning Tower of Pisa is known worldwide for its nearly four- degree lean. The height of the tower is 55.86 meters from the ground on the low side, and 56.67 meters on the high side....
 6. [10 points) For the following question, to model the free fall of a falling rock, assume the usual idealizing simplifications for solving "free fall" problems. Work with the approximate value g = 9.8 m/s2 for the Earth's gravitational acceleration. Consider the following experiment. The Leaning Tower of Pisa is known worldwide for its nearly four- degree lean. The height of the tower is 55.86 meters from the ground on the low side, and 56.67 meters on the high side....
Most questions answered within 3 hours.
-
The number of major faults on a randomly chosen 1 km stretch of
highway has a...
asked 3 minutes ago -
Consider the competitive environment of Starbuck's, Progressive
Insurance, a manufacturing firm with low turnover, or a...
asked 50 minutes ago -
3. Gains from trade
Consider two neighbouring island countries called Euphoria and
Contente. They each have...
asked 2 hours ago -
A business executive has the option to invest money in two
plans: Plan A guarantees that...
asked 5 hours ago -
Hello, can someone please help me answer this question?
How much heat is absorbed by a...
asked 5 hours ago -
. A marketing researcher conducted a survey of 25 shoppers
randomly selected at the local mall...
asked 5 hours ago -
Create an comprehensive response to the
following:
Antimicrobial agents work on a multitude of microbes (bacteria,...
asked 5 hours ago -
6.13 LAB: Step counter. Section 6.3.
A pedometer treats walking 2,000 steps as walking 1 mile....
asked 5 hours ago -
(14.2) A block of mass m = 10 kg riding on a frictionless
horizontal plane is...
asked 5 hours ago -
Use any search engine to search for articles about Starbucks
partnership with Tata Companies in India...
asked 5 hours ago -
Let’s say that for some reason Bank Excess Reserves suddenly
increase sharply. What effect would this...
asked 5 hours ago -
Given:
Curent Assets: $600,000
Total Assets: $2,600,000
Current Liabilities: $500,000
Total Liabilities: $1,700,000
What is the...
asked 5 hours ago