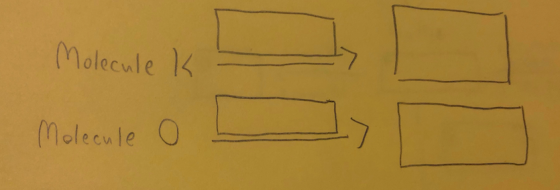
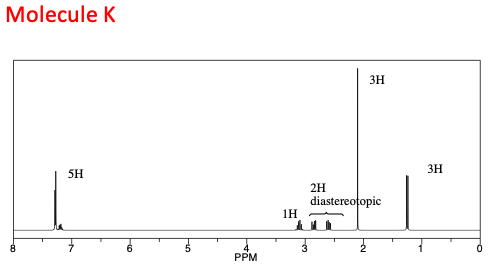
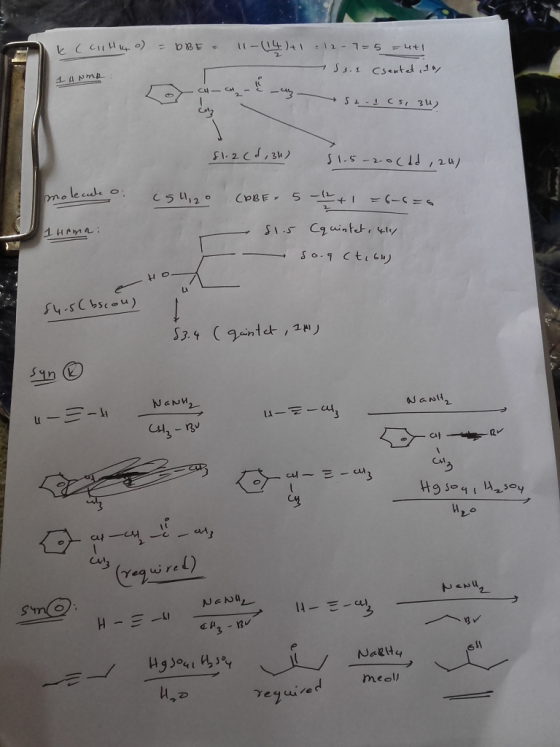
Show the synthesis from acetylene for K (C11 H14 O) and O (C5 H12 O) using the spectra below

Homework Answers
Add Answer to:
Show the synthesis from acetylene for K (C11 H14 O) and O (C5 H12 O) using the spectra below Molecule 1 Molecule O Mol...
Use the spectra below to answer for K and O Show the synthesis of Kt o...
 Use the spectra below to answer for K and O
Show the synthesis of Kt o from acetylene. PAFT I SYNTHESIS син o С, но . Molecule K 5H 2H diastereotopic - 1H PPM Molecule o 6H 4H 1H 1Н exchangeable PPM
Use the spectra below to answer for K and O
Show the synthesis of Kt o from acetylene. PAFT I SYNTHESIS син o С, но . Molecule K 5H 2H diastereotopic - 1H PPM Molecule o 6H 4H 1H 1Н exchangeable PPM
Use the spectra above to determine the reactions and the products of K, and O Answer...
 Use the spectra above to determine the reactions and the
products of K, and O
Answer in the boxes below
Reactions
Products
Syaimin tg Kio fmи аеyene adyene РАРТ Show Yu SprTHEGNS CuHMO CsHO Molecule K ЗН 3H 5H 2H diastereotopic 1н PPM o Molecule O 6H 4H 1H 1H exchangeable PPM K O К O
Use the spectra above to determine the reactions and the
products of K, and O
Answer in the boxes below
Reactions
Products
Syaimin tg Kio fmи аеyene adyene РАРТ Show Yu SprTHEGNS CuHMO CsHO Molecule K ЗН 3H 5H 2H diastereotopic 1н PPM o Molecule O 6H 4H 1H 1H exchangeable PPM K O К O
Use the spectra below to fill in the boxes for the reaction above. If it isn't clear box J is (C11 H24 O) and box I is...
 Use the spectra below to fill in the boxes for the reaction
above.
If it isn't clear box J is (C11 H24 O) and box I is (C9 H10
O)
NARCC H240) NMR (Cq HOO) Molecule 9H Зн 2н 2н PPM Molecule ) 9H ЗН ін 2H 2H Е -
Use the spectra below to fill in the boxes for the reaction
above.
If it isn't clear box J is (C11 H24 O) and box I is (C9 H10
O)
NARCC H240) NMR (Cq HOO) Molecule 9H Зн 2н 2н PPM Molecule ) 9H ЗН ін 2H 2H Е -
Use the spectra below to fill in all the letter spaces in the Guided synthesis Molecule 9H Зн 2н 2н PPM Molecule ) 9H...
 Use the spectra below to fill in all the letter spaces in the
Guided synthesis
Molecule 9H Зн 2н 2н PPM Molecule ) 9H ЗН ін 2H 2H Е - Molecule F IH L6H 2H2H Clotis 1. Imole Hel 1.Li/NH3 -78°c 2. Mc PBA 2. 1 mole HI Kamaryu H NMR/IR VE c) H₂O FNne) (NMR/IR lCq H180 co ter) C10Hz, Br
Use the spectra below to fill in all the letter spaces in the
Guided synthesis
Molecule 9H Зн 2н 2н PPM Molecule ) 9H ЗН ін 2H 2H Е - Molecule F IH L6H 2H2H Clotis 1. Imole Hel 1.Li/NH3 -78°c 2. Mc PBA 2. 1 mole HI Kamaryu H NMR/IR VE c) H₂O FNne) (NMR/IR lCq H180 co ter) C10Hz, Br
Below is the H NMR spectra for the molecule styrene. Consider if a hydroboration reaction was...
 Below is the H NMR spectra for the molecule styrene.
Consider if a hydroboration reaction was preformed on styrene.
How would the H NMR of the expected product change in comparison to
styrene? Circle which peaks from the styrene spectra would
disappear and not be present in the NMR of the product.
Draw the expected product. Describe the splitting pattern of
each new proton signal that would appear in the NMR of the
product.
2) Below is the 'H NMR...
Below is the H NMR spectra for the molecule styrene.
Consider if a hydroboration reaction was preformed on styrene.
How would the H NMR of the expected product change in comparison to
styrene? Circle which peaks from the styrene spectra would
disappear and not be present in the NMR of the product.
Draw the expected product. Describe the splitting pattern of
each new proton signal that would appear in the NMR of the
product.
2) Below is the 'H NMR...
Spectroscopy Unknown. The spectra and data provided were obtained from a pure organic molecule. For 1...
 Spectroscopy Unknown. The spectra and data provided were
obtained from a pure organic molecule. For 1 H NMR Spectra, the
integral is given in number of hydrogens (#H) or as a relative
ratio. Important coupling constants (J-values) are listed next to
the peaks for some examples. For some spectra, an inset (grey box)
is also given showing a “zoom-in” on an important part of the
spectrum.
Mass Spectrum (not shown): [M] = 169 (100%) m/z IR Spectrum (not shown): 2985,...
Spectroscopy Unknown. The spectra and data provided were
obtained from a pure organic molecule. For 1 H NMR Spectra, the
integral is given in number of hydrogens (#H) or as a relative
ratio. Important coupling constants (J-values) are listed next to
the peaks for some examples. For some spectra, an inset (grey box)
is also given showing a “zoom-in” on an important part of the
spectrum.
Mass Spectrum (not shown): [M] = 169 (100%) m/z IR Spectrum (not shown): 2985,...
NEED HELP WITH B) C) D) E) F) and G) that apply to the spectra below....
 NEED HELP WITH B) C) D) E) F) and G) that apply to the
spectra below.
OTHER ANSWERS ARE THERE TO SUPPLEMENT
Thank you!
5. Using the GC mentioned in question 4 and the values listed on
the chromatogram for the height and width (at half height) of each
peak, calculate the percent composition for each product (A, B and
C). Be sure to show your work.
Area of peak A = 125 x 8 =
1000mm2
Area of peak...
NEED HELP WITH B) C) D) E) F) and G) that apply to the
spectra below.
OTHER ANSWERS ARE THERE TO SUPPLEMENT
Thank you!
5. Using the GC mentioned in question 4 and the values listed on
the chromatogram for the height and width (at half height) of each
peak, calculate the percent composition for each product (A, B and
C). Be sure to show your work.
Area of peak A = 125 x 8 =
1000mm2
Area of peak...
Unknown H415 100 50 1000 1S00 2000 3000 BRVENUMBERI 4000 Unknown H415 ЗН 1 H-N 2H,...
 Unknown H415 100 50 1000 1S00 2000 3000 BRVENUMBERI 4000 Unknown H415 ЗН 1 H-N 2H, q 1H, d 5H, m 1H, d 0 1 2 3 6 7 8 10 11 ppm HSP-00-049 Unknown H415 q 140 120 100 200 180 160 ppm CDS-00-726 20 -40 60 80 Relative Intensity 09 Unknown H415 100 MS-NJ-0442 80 20 thmpt 25 50 75 100 125 150 175 m/z Date: Name: Section/Group: Instructor: Report Sheet: Laboratory 14 MS,IR, 13C NMR, and 'H...
 Use the spectra below to answer for K and O
Show the synthesis of Kt o from acetylene. PAFT I SYNTHESIS син o С, но . Molecule K 5H 2H diastereotopic - 1H PPM Molecule o 6H 4H 1H 1Н exchangeable PPM
Use the spectra below to answer for K and O
Show the synthesis of Kt o from acetylene. PAFT I SYNTHESIS син o С, но . Molecule K 5H 2H diastereotopic - 1H PPM Molecule o 6H 4H 1H 1Н exchangeable PPM
 Use the spectra above to determine the reactions and the
products of K, and O
Answer in the boxes below
Reactions
Products
Syaimin tg Kio fmи аеyene adyene РАРТ Show Yu SprTHEGNS CuHMO CsHO Molecule K ЗН 3H 5H 2H diastereotopic 1н PPM o Molecule O 6H 4H 1H 1H exchangeable PPM K O К O
Use the spectra above to determine the reactions and the
products of K, and O
Answer in the boxes below
Reactions
Products
Syaimin tg Kio fmи аеyene adyene РАРТ Show Yu SprTHEGNS CuHMO CsHO Molecule K ЗН 3H 5H 2H diastereotopic 1н PPM o Molecule O 6H 4H 1H 1H exchangeable PPM K O К O
 Use the spectra below to fill in the boxes for the reaction
above.
If it isn't clear box J is (C11 H24 O) and box I is (C9 H10
O)
NARCC H240) NMR (Cq HOO) Molecule 9H Зн 2н 2н PPM Molecule ) 9H ЗН ін 2H 2H Е -
Use the spectra below to fill in the boxes for the reaction
above.
If it isn't clear box J is (C11 H24 O) and box I is (C9 H10
O)
NARCC H240) NMR (Cq HOO) Molecule 9H Зн 2н 2н PPM Molecule ) 9H ЗН ін 2H 2H Е -
 Use the spectra below to fill in all the letter spaces in the
Guided synthesis
Molecule 9H Зн 2н 2н PPM Molecule ) 9H ЗН ін 2H 2H Е - Molecule F IH L6H 2H2H Clotis 1. Imole Hel 1.Li/NH3 -78°c 2. Mc PBA 2. 1 mole HI Kamaryu H NMR/IR VE c) H₂O FNne) (NMR/IR lCq H180 co ter) C10Hz, Br
Use the spectra below to fill in all the letter spaces in the
Guided synthesis
Molecule 9H Зн 2н 2н PPM Molecule ) 9H ЗН ін 2H 2H Е - Molecule F IH L6H 2H2H Clotis 1. Imole Hel 1.Li/NH3 -78°c 2. Mc PBA 2. 1 mole HI Kamaryu H NMR/IR VE c) H₂O FNne) (NMR/IR lCq H180 co ter) C10Hz, Br
 Below is the H NMR spectra for the molecule styrene.
Consider if a hydroboration reaction was preformed on styrene.
How would the H NMR of the expected product change in comparison to
styrene? Circle which peaks from the styrene spectra would
disappear and not be present in the NMR of the product.
Draw the expected product. Describe the splitting pattern of
each new proton signal that would appear in the NMR of the
product.
2) Below is the 'H NMR...
Below is the H NMR spectra for the molecule styrene.
Consider if a hydroboration reaction was preformed on styrene.
How would the H NMR of the expected product change in comparison to
styrene? Circle which peaks from the styrene spectra would
disappear and not be present in the NMR of the product.
Draw the expected product. Describe the splitting pattern of
each new proton signal that would appear in the NMR of the
product.
2) Below is the 'H NMR...
 Spectroscopy Unknown. The spectra and data provided were
obtained from a pure organic molecule. For 1 H NMR Spectra, the
integral is given in number of hydrogens (#H) or as a relative
ratio. Important coupling constants (J-values) are listed next to
the peaks for some examples. For some spectra, an inset (grey box)
is also given showing a “zoom-in” on an important part of the
spectrum.
Mass Spectrum (not shown): [M] = 169 (100%) m/z IR Spectrum (not shown): 2985,...
Spectroscopy Unknown. The spectra and data provided were
obtained from a pure organic molecule. For 1 H NMR Spectra, the
integral is given in number of hydrogens (#H) or as a relative
ratio. Important coupling constants (J-values) are listed next to
the peaks for some examples. For some spectra, an inset (grey box)
is also given showing a “zoom-in” on an important part of the
spectrum.
Mass Spectrum (not shown): [M] = 169 (100%) m/z IR Spectrum (not shown): 2985,...
 NEED HELP WITH B) C) D) E) F) and G) that apply to the
spectra below.
OTHER ANSWERS ARE THERE TO SUPPLEMENT
Thank you!
5. Using the GC mentioned in question 4 and the values listed on
the chromatogram for the height and width (at half height) of each
peak, calculate the percent composition for each product (A, B and
C). Be sure to show your work.
Area of peak A = 125 x 8 =
1000mm2
Area of peak...
NEED HELP WITH B) C) D) E) F) and G) that apply to the
spectra below.
OTHER ANSWERS ARE THERE TO SUPPLEMENT
Thank you!
5. Using the GC mentioned in question 4 and the values listed on
the chromatogram for the height and width (at half height) of each
peak, calculate the percent composition for each product (A, B and
C). Be sure to show your work.
Area of peak A = 125 x 8 =
1000mm2
Area of peak...
 Unknown H415 100 50 1000 1S00 2000 3000 BRVENUMBERI 4000 Unknown H415 ЗН 1 H-N 2H, q 1H, d 5H, m 1H, d 0 1 2 3 6 7 8 10 11 ppm HSP-00-049 Unknown H415 q 140 120 100 200 180 160 ppm CDS-00-726 20 -40 60 80 Relative Intensity 09 Unknown H415 100 MS-NJ-0442 80 20 thmpt 25 50 75 100 125 150 175 m/z Date: Name: Section/Group: Instructor: Report Sheet: Laboratory 14 MS,IR, 13C NMR, and 'H...
Most questions answered within 3 hours.
-
Angel Corporation has $10,000,000 of
8.0% 25 year bonds dated May 1, 2018 with interest payable...
asked 15 minutes ago -
7.
________ involves individuals trading goods they already have or
providing services in exchange for something...
asked 20 minutes ago -
Share your research problem. What databases did you search as
you gathered evidence to support your...
asked 20 minutes ago -
what process occurs to form microspores and megaspores in flowering
plants?
asked 27 minutes ago -
C++
I need to use the function getData to put in all my data using
arrays....
asked 26 minutes ago -
A block is hung by a string from the inside roof of a van. When
the...
asked 33 minutes ago -
Do you think companies should not go for long term debt in their
capital structure to...
asked 42 minutes ago -
I create an address book where the user enters the name, phone
and email in the...
asked 48 minutes ago -
The production capacity for acrylonitrile
(C3H3N) in the United States exceeds 2
million pounds per year....
asked 56 minutes ago -
explain and comment out your answer
43. How many address lines are required to address a...
asked 1 hour ago -
A sample of 45 observations is selected from a normal
population. The sample mean is 49,...
asked 1 hour ago -
A construction company is planning to bid on a building
contract. The bid costs the company...
asked 1 hour ago