

Homework Answers
Add Answer to:
Consider an ecohomy in which only two products like T-shirts and Pizza (slices) are produced. The quantity produce...
The country of Sylvania produces and consumes only three goods: Red Bull, pizza, and T-shirts. The...
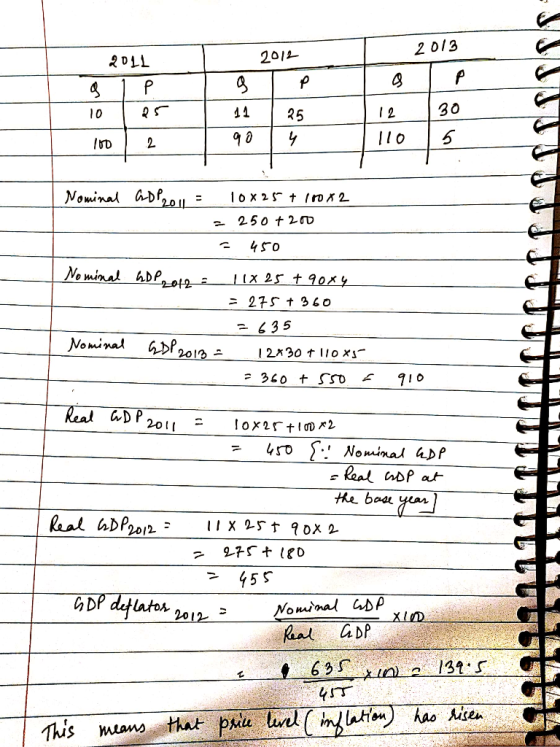
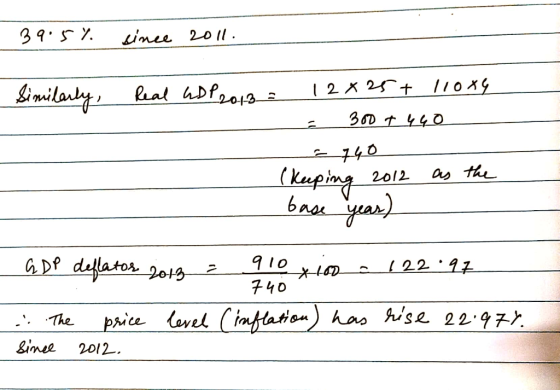
The country of Sylvania produces and consumes only three goods: Red Bull, pizza, and T-shirts. The quantity produced and price of each good in 2011 and 2012 are given in the following table: 20112012 QuantityPriceQuantityPriceT-Shirts100$25110$25Red Bull (cans)500$1500$1.50Pizza (slices)1000$2900$4a. Calculate nominal GDP for 2011 and 2012.b. Using 2011 as the base year, calculate real GDP for 2011 and 2012.c. Based on your answer from part b, by what percent age did real GDP grow between 2011 and 2012?d. Now, calculate real GDP...
The country of Sylvania produces and consumes only three goods: Red Bull, pizza, and T-shirts. The quantity produced and price of each good in 2011 and 2012 are given in the following table:
The country of Sylvania produces and consumes only three goods: Red Bull, pizza, and T-shirts. The quantity produced and price of each good in 2011 and 2012 are given in the following table:20112012QuantityPriceQuantityPriceT-Shirts90$25108$25Red Bull (cans)510$2510$3Pizza (slices)980$3900$6Nominal GDP in 2011 was $nothing and nominal GDP in 2012 was $nothing. (Enter your responses as integers.)If 2011 is the base year, real GDP in 2011 was $nothing and real GDP in 2012 was $nothing. (Enter your responses as integers.)Based on your answer above, the percentage change in real GDP between 2011...
The country of Sylvania produces and consumes only three goods: Red Bull, pizza, and T-shirts. The...
 The country of Sylvania produces and consumes only three goods: Red Bull, pizza, and T-shirts. The quantity produced and price of each good in 2011 and 2012 are given in the following table: 2011 Quantity 90 T-Shirts Red Bull (cans) Pizza (slices) Price $24 $2 $3 2012 Quantity 108 500 940 Price $24 $3 $6 500 1020 Nominal GDP in 2011 was $ 6220 and nominal GDP in 2012 was $ 9732). (Enter your responses as integers.) If 2011 is...
Assume that an economy produces only three goods; Computers, cars, and pizza. Table 1 gives the price and quantity for each good and the number of employed and unemployed individuals for the years 2010-2013. Table 2 gives the fixed basket used for calcula
 Assume that an economy produces
only three goods; Computers, cars, and pizza. Table 1 gives the price
and quantity for each good and the number of employed and unemployed
individuals for the years 2010-2013. Table 2 gives the fixed basket used
for calculating the CPI. Assume that the base year is 2011 and show
your work! Table 1 - Price and Quantity of Goods Sold in 2010-2013 2010
2011 2012 2013 P Q P O P Q 25 Computers Cars...
Assume that an economy produces
only three goods; Computers, cars, and pizza. Table 1 gives the price
and quantity for each good and the number of employed and unemployed
individuals for the years 2010-2013. Table 2 gives the fixed basket used
for calculating the CPI. Assume that the base year is 2011 and show
your work! Table 1 - Price and Quantity of Goods Sold in 2010-2013 2010
2011 2012 2013 P Q P O P Q 25 Computers Cars...
ext Problem 8 The country of Syvania produces and consumes only three goods: Red Bull, pizza,...
 ext Problem 8 The country of Syvania produces and consumes only three goods: Red Bull, pizza, and Tshirts. The quantty produced and price of each good in 2011 and 2012 are given in the following table 2011 2012 Quantity Price Quantity Price 80 540 1020 526 $2 $3 $26 T-Shirts Red Bull (cans) Pizza (alices) 95 540 040 $6 Nominal GOP in 2011 was and nominal GDP in 2012 was sEnter your responses as intepers)
5. The economy of Britannica produces three Year Computers DVDs Pizzas goods: computers, DVDs, and pizza....
 5. The economy of Britannica produces three Year Computers DVDs Pizzas goods: computers, DVDs, and pizza. The Price Quantity Price Quantity Price Quantity accompanying table shows the prices and 2010 $900 10 $10 100 15 2 output of the three goods for the years 2011 1,000 10.5 12 105 16 2 2012 1,050 12 14 110 2010, 2011, and 2012. a. Calculate nominal GDP in Britannica for each of the three years. What is the per- cent change in nominal...
The monthly market basket for consumers consists of pizza, t-shirts, and rent. The table below shows...
 The monthly market basket for consumers consists of pizza, t-shirts, and rent. The table below shows market basket quantities and prices for the base year (Year 1) and in the following two years. Base Year (Year 1) Quantity Product Pizza T-Shirts Rent Price in the Base Year .$3.50 $25.00 $350.00 Price in Year 2 $4.38 $22.50 $385.00 Price in Year 3 $4.73 $26.25 $455.00 The inflation rate between Year 1 and Year 2 is The inflation rate between Year 2...
8. The monthly market basket for consumers consists of pizza, t-shirts, and rent. The table below...
 8. The monthly market basket for consumers consists of pizza, t-shirts, and rent. The table below shows market basket quantities and prices for the base year (Year 1) and in the following two years. Base Year (Year 1) Quantity Product Pizza T-Shirts Rent 20 Price in the Base Year $3.00 $10.00 $450.00 Price in Year 2 $3.75 $9.00 $495.00 Price in Year 3 $4.50 $10.50 $562.50 %. (Round both answers to one decimal place.) The inflation rate between Year 1...
The monthly market basket for consumers consists of pizza, t-shirts, and rent. The table below shows market basket quan...
 The monthly market basket for consumers consists of pizza, t-shirts, and rent. The table below shows market basket quantities and prices for the base year (Year 1) and in the following two years. Product Base Year (Year 1) Quantity Pizza Price in the Base Year $2.50 $10.00 $300.00 Price in Year 2 $3.13 $9.00 $330.00 Price in Year 3 $3.38 $8.50 $390.00 T-Shirts Rent The inflation rate between Year 1 and Year 2 is The inflation rate between Year 2...
1. Consider the following table for an economy that produces only six goods 2016 2018 Goods...
 1. Consider the following table for an economy that produces only six goods 2016 2018 Goods PricelQuantity Price Quantity Pizza$410 S8 12 Shoe 12 20 36 15 T-Shirts 6 10 15 Bread2 Water1 Cola4 10 10 Assuming that 2016 is the base year, find the following; (Please show all calculations) (a) The values for nominal GDP for 2016 and 20118 (b) The values for real GDP for 2016 and 2018 (c) The GDP deflator for 2016 and 2018 (d) The...
 The country of Sylvania produces and consumes only three goods: Red Bull, pizza, and T-shirts. The quantity produced and price of each good in 2011 and 2012 are given in the following table: 2011 Quantity 90 T-Shirts Red Bull (cans) Pizza (slices) Price $24 $2 $3 2012 Quantity 108 500 940 Price $24 $3 $6 500 1020 Nominal GDP in 2011 was $ 6220 and nominal GDP in 2012 was $ 9732). (Enter your responses as integers.) If 2011 is...
 ext Problem 8 The country of Syvania produces and consumes only three goods: Red Bull, pizza, and Tshirts. The quantty produced and price of each good in 2011 and 2012 are given in the following table 2011 2012 Quantity Price Quantity Price 80 540 1020 526 $2 $3 $26 T-Shirts Red Bull (cans) Pizza (alices) 95 540 040 $6 Nominal GOP in 2011 was and nominal GDP in 2012 was sEnter your responses as intepers)
 5. The economy of Britannica produces three Year Computers DVDs Pizzas goods: computers, DVDs, and pizza. The Price Quantity Price Quantity Price Quantity accompanying table shows the prices and 2010 $900 10 $10 100 15 2 output of the three goods for the years 2011 1,000 10.5 12 105 16 2 2012 1,050 12 14 110 2010, 2011, and 2012. a. Calculate nominal GDP in Britannica for each of the three years. What is the per- cent change in nominal...
 The monthly market basket for consumers consists of pizza, t-shirts, and rent. The table below shows market basket quantities and prices for the base year (Year 1) and in the following two years. Base Year (Year 1) Quantity Product Pizza T-Shirts Rent Price in the Base Year .$3.50 $25.00 $350.00 Price in Year 2 $4.38 $22.50 $385.00 Price in Year 3 $4.73 $26.25 $455.00 The inflation rate between Year 1 and Year 2 is The inflation rate between Year 2...
 8. The monthly market basket for consumers consists of pizza, t-shirts, and rent. The table below shows market basket quantities and prices for the base year (Year 1) and in the following two years. Base Year (Year 1) Quantity Product Pizza T-Shirts Rent 20 Price in the Base Year $3.00 $10.00 $450.00 Price in Year 2 $3.75 $9.00 $495.00 Price in Year 3 $4.50 $10.50 $562.50 %. (Round both answers to one decimal place.) The inflation rate between Year 1...
 The monthly market basket for consumers consists of pizza, t-shirts, and rent. The table below shows market basket quantities and prices for the base year (Year 1) and in the following two years. Product Base Year (Year 1) Quantity Pizza Price in the Base Year $2.50 $10.00 $300.00 Price in Year 2 $3.13 $9.00 $330.00 Price in Year 3 $3.38 $8.50 $390.00 T-Shirts Rent The inflation rate between Year 1 and Year 2 is The inflation rate between Year 2...
 1. Consider the following table for an economy that produces only six goods 2016 2018 Goods PricelQuantity Price Quantity Pizza$410 S8 12 Shoe 12 20 36 15 T-Shirts 6 10 15 Bread2 Water1 Cola4 10 10 Assuming that 2016 is the base year, find the following; (Please show all calculations) (a) The values for nominal GDP for 2016 and 20118 (b) The values for real GDP for 2016 and 2018 (c) The GDP deflator for 2016 and 2018 (d) The...
Most questions answered within 3 hours.
-
How much is the
multiplier?. Here are some facts about the economy of Inferior.
Marginal propensity...
asked 37 seconds from now -
I am getting an error that the variable num was not declared in
the scope on...
asked 18 seconds from now -
Twenty students took a test. The average grade was 86 with a
standard deviation of 9....
asked 3 minutes ago -
Peroxyacetyl Nitrate (PAN) is formed by addition of NO2
to the corresponding peroxyacetyl radical. PAN is...
asked 3 minutes ago -
Suppose that at a large university 30% of students are involved
in intramural sports. If we...
asked 11 minutes ago -
Answer items 7 and 8 from the following information:
The mean for VO2max is 50 ml/kg/min...
asked 12 minutes ago -
The formation factor of a rock sample is 50. Calculate the
porosity if the sample is;...
asked 13 minutes ago -
If the anion in an insoluble salt is a conjugate base of a weak
acid, will...
asked 19 minutes ago -
2. The East Street Bagel Shop has a weekly demand for 3,500
bagels, which they make...
asked 35 minutes ago -
The purpose of this study was to
assess the vitamin D status of pregnant women residing...
asked 36 minutes ago -
Please answer each question in 150 words, from the eyes of
someone in the hospitality/hotel field...
asked 41 minutes ago -
A simple random sample of 35 colleges and universities in the
United States has a mean...
asked 43 minutes ago