Consider the following demand and supply schedule for eggs in USA for a given month (quantity figures are in millions o...
- Consider the following demand and supply schedule for eggs in USA for a given month (quantity figures are in millions of dozens):
|
Price per dozen |
Quantity demanded |
Quantity supplied |
|
$0.50 |
40 |
10 |
|
$1.00 |
30 |
30 |
|
$1.50 |
20 |
50 |
|
$2.00 |
30 |
70 |
|
$2.50 |
40 |
90 |
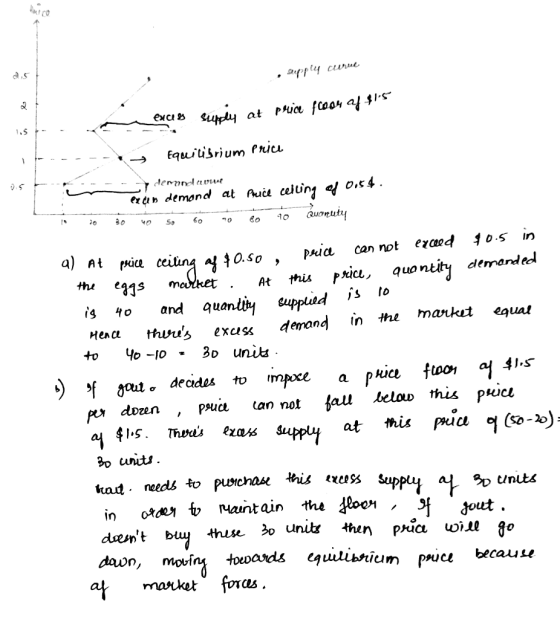
a) Suppose a price ceiling of $0.50 per dozen is imposed on the egg market, in order to help egg consumers. Will there be an excess demand or an excess supply in the egg market? Of what value? Illustrate this excess supply or demand on your graph.
b) Suppose instead that the government decides to impose a price floor of $1.50 per dozen in order to help egg producers. How many eggs must the government purchase to maintain the floor? Illustrate on your diagram.
Homework Answers
The question can be answered by plotting the demand and the supply curve on the graph And observing the demand and supply at the price floor and the price ceiling given to come to the answers.
A price ceiling is the price imposed below the Equilibrium price by the government so as to help the consumers as the price can't go above the price ceiling.
A price floor is the price imposed above the equilibrium price by the government such that the price is not allowed to fall below the price floor. It is done to help the producers.
Add Answer to:
Consider the following demand and supply schedule for eggs in USA for a given month (quantity figures are in millions o...
Consider the following demand and supply schedule for eggs in USA for a given month (quantity figures are in millions of...
Consider the following demand and supply schedule for eggs in USA for a given month (quantity figures are in millions of dozens) : Price per dozen Quantity demanded Quantity supplied $0.50 40 10 $1.00 30 30 $1.50 20 50 $2.00 30 70 $2.50 40 90 Carefully graph the supply and demand curves. And identify the equilibrium price and quantity on your graph Calculate the total revenue of all egg producers in equilibrium Calculate the price elasticity of demand for a...
Consider the following demand and supply schedule for eggs in USA for a given month (quantity...
Consider the following demand and supply schedule for eggs in USA for a given month (quantity figures are in millions of dozens) : Price per dozen Quantity demanded Quantity supplied $0.50 40 10 $1.00 30 30 $1.50 20 50 $2.00 30 70 $2.50 40 90 a. Carefully graph the supply and demand curves. And identify the equilibrium price and quantity on your graph b. Calculate the total revenue of all egg producers in equilibrium c. Calculate the price elasticity of demand for a...
18. Consider the following demand and supply schedule for eggs in USA for a given mooth...
 18. Consider the following demand and supply schedule for eggs in USA for a given mooth (quantity figures are in millions of dozens): Price per dozen Quantity demanded Quantity supplied $0.50 $1.00 $1.50 $2.00 $2.50 a. Calculate the price elasticity of demand for a price change from $0.50 to $1.00, from $1.00 to $1.50, from $1.50 to $2.00, and from $2.00 to $2.50. (calculate the change in total expenditure if consumers could buy the quantities they wanted at sach prise....
Suppose the demand and supply curves for eggs in the United States are given by the...
 Suppose the demand and supply curves for eggs in the United States are given by the following equations: Qi = 100 – 20P Q. = 10 + 40P where Qd = millions of dozens of eggs Americans would like to buy each year; Q = millions of dozens of eggs U.S. farms would like to sell each year; and P = price per dozen eggs. a. Fill in the following table: Price (Per Dozen) Quantity Demanded (Q) Quantity Supplied (2.)...
$ 75 Supply .6아ㅡㅡㅡㅡㅡ: 30 .15 0 Demand 12 3 4 5 6 Quantity (1,000s of...
 $ 75 Supply .6아ㅡㅡㅡㅡㅡ: 30 .15 0 Demand 12 3 4 5 6 Quantity (1,000s of units per time pecriod) ose the above graph represents the market for carrots. If government's goal is to Supp keep the price of carrots a. allow market forces to determine the equilibrium price. b. impose a price ceiling at $0.60 per unit. c. impose a price floor at $0.60 per unit. d. implement a system of rationing carrots to limit consumption per household. at...
Consider the market for corn. Suppose the market demand and supply curves are as given. Demand:...
 Consider the market for corn. Suppose the market demand and supply curves are as given. Demand: P = 270-3QD; Supply P = 30 + QS. Price is the price per metric ton (in cents). 1) Calculate the equilibrium price (P) and quantity (Q). 2) If the government impose a price floor of 100 cents per metric ton on corn, calculate the quantity demanded, quantity supplies and the surplus/ shortage at this price.
The demand and supply conditions of market for beer are given by the following equations: Qd...
 The demand and supply conditions of market for beer are given by the following equations: Qd = 72 - P and Qs = -18 + P a) Find the initial equilibrium price and quantity. b) Calculate the consumer surplus and producer surplus for the equilibrium. c) Suppose that government impose a price floor at P=66 to control the consumption of beer. Is this policy effective? What are price and quantity consumed after this intervention of government? d) Going back to...
5. TAXES/SUBSIDIES, AND OTHER GOVERNMENT REGULATIONS 1. Consider the demand and supply for bubbly water in...
 5. TAXES/SUBSIDIES, AND OTHER GOVERNMENT REGULATIONS 1. Consider the demand and supply for bubbly water in a market represented by the following equations: QD = 15 - 10P QS = 40P - 50 where Q is millions of bottles per year and P measures dollars per bottle. The equilibrium price of bubbly water is $1.30 per bottle and 2 million bottles are sold each year. (a) Calculate the price elasticity of demand and the price elasticity of supply at the...
The wheat market is perfectly competitive, and the market supply and demand curves are given by the following equations:
The wheat market is perfectly competitive, and the market supply and demand curves are given by the following equations: QD = 20,000,000 - 4,000,000P QS = 7,000,000 + 2,500,000P, where QD and QS are quantity demanded and quantity supplied measured in bushels, and P = price per bushel. a. Determine consumer surplus at the equilibrium price and quantity. b. Assume that the government has imposed a price floor at $2.25 per bushel and agrees to buy any resulting excess supply. How many bushels of wheat...
A market is described by the following supply and demand curves: Qs = 3P Qd =...
 A market is described by the following supply and demand curves: Qs = 3P Qd = 400-P The equilibrium price is S and the equilibrium quantity is Suppose the government imposes a price ceiling of $80. This price ceiling is , and the market price will be supplied will be . and the quantity demanded will be . Therefore, a price calling of $60 will result in the quantity the quantity Suppose the government imposes a price floor of $80....
 18. Consider the following demand and supply schedule for eggs in USA for a given mooth (quantity figures are in millions of dozens): Price per dozen Quantity demanded Quantity supplied $0.50 $1.00 $1.50 $2.00 $2.50 a. Calculate the price elasticity of demand for a price change from $0.50 to $1.00, from $1.00 to $1.50, from $1.50 to $2.00, and from $2.00 to $2.50. (calculate the change in total expenditure if consumers could buy the quantities they wanted at sach prise....
 Suppose the demand and supply curves for eggs in the United States are given by the following equations: Qi = 100 – 20P Q. = 10 + 40P where Qd = millions of dozens of eggs Americans would like to buy each year; Q = millions of dozens of eggs U.S. farms would like to sell each year; and P = price per dozen eggs. a. Fill in the following table: Price (Per Dozen) Quantity Demanded (Q) Quantity Supplied (2.)...
 $ 75 Supply .6아ㅡㅡㅡㅡㅡ: 30 .15 0 Demand 12 3 4 5 6 Quantity (1,000s of units per time pecriod) ose the above graph represents the market for carrots. If government's goal is to Supp keep the price of carrots a. allow market forces to determine the equilibrium price. b. impose a price ceiling at $0.60 per unit. c. impose a price floor at $0.60 per unit. d. implement a system of rationing carrots to limit consumption per household. at...
 Consider the market for corn. Suppose the market demand and supply curves are as given. Demand: P = 270-3QD; Supply P = 30 + QS. Price is the price per metric ton (in cents). 1) Calculate the equilibrium price (P) and quantity (Q). 2) If the government impose a price floor of 100 cents per metric ton on corn, calculate the quantity demanded, quantity supplies and the surplus/ shortage at this price.
 The demand and supply conditions of market for beer are given by the following equations: Qd = 72 - P and Qs = -18 + P a) Find the initial equilibrium price and quantity. b) Calculate the consumer surplus and producer surplus for the equilibrium. c) Suppose that government impose a price floor at P=66 to control the consumption of beer. Is this policy effective? What are price and quantity consumed after this intervention of government? d) Going back to...
 5. TAXES/SUBSIDIES, AND OTHER GOVERNMENT REGULATIONS 1. Consider the demand and supply for bubbly water in a market represented by the following equations: QD = 15 - 10P QS = 40P - 50 where Q is millions of bottles per year and P measures dollars per bottle. The equilibrium price of bubbly water is $1.30 per bottle and 2 million bottles are sold each year. (a) Calculate the price elasticity of demand and the price elasticity of supply at the...
 A market is described by the following supply and demand curves: Qs = 3P Qd = 400-P The equilibrium price is S and the equilibrium quantity is Suppose the government imposes a price ceiling of $80. This price ceiling is , and the market price will be supplied will be . and the quantity demanded will be . Therefore, a price calling of $60 will result in the quantity the quantity Suppose the government imposes a price floor of $80....
Most questions answered within 3 hours.
-
What's the streaming business's problem on the
horizon?
asked 7 minutes ago -
I need help with writing the conclusion for this online lab
report
Abstract
By testing the...
asked 20 minutes ago -
For the reaction 1N2+3H2-----> 2NH3, would the reaction rate
trend be: delta[NH3]/ delta t = -2...
asked 55 minutes ago -
Within your current/past organization, identify a problem/issue
and format a design to address same. You may...
asked 37 minutes ago -
A sock stuck to the side of a clothes-dryer barrel has a
centripetal acceleration of 24...
asked 1 hour ago -
A perfect gas undergoes an isentropic process such that its
volume doubles. If the ratio of...
asked 2 hours ago -
list the elements in groups 3A to 6A in the same order as in the
periodic...
asked 2 hours ago -
Estimating effect size. Peng and Chen (2014)
evaluated effect size estimates for various tests. In their...
asked 2 hours ago -
Write a script in MySQL that creates and calls a stored
procedure name test. This procedure...
asked 2 hours ago -
If we test the following: H0: μ = 17
vs. H1: μ ≠ 17 and the...
asked 2 hours ago -
in the past year TVG had revenues of 3 million, cost
of goods sold of $25...
asked 2 hours ago -
4) In a polypeptide, which bond cannot rotate because of its
partial double bond character?
The...
asked 3 hours ago