


Homework Answers
Add Answer to:
Consider the aggregate economy for the United States in 2007 and 2008, represented by the graph below. In which...
Consider the aggregate economy for the United States in 1929 and 1930, represented by the graph below. What is the rate of growth in real GDP, if any? Provide your answer as a percent rounded to two...
 Consider the aggregate economy for the United States in 1929 and 1930, represented by the graph below. What is the rate of growth in real GDP, if any? Provide your answer as a percent rounded to two decimal places. Use a negative sign "-" for negative changes. Do not include any symbols, such as "S," ", "%," or "," in your answer. LRAS1929 SRASi LRAS1930 SRAS1929 Price level (GDP deflator, 2009 100) 10.6 10.2 AD1930 D1929 965.8 1005.6 1006.3 1094.1...
Consider the information in the figure below for a hypothetical economy. What is the multiplier for...
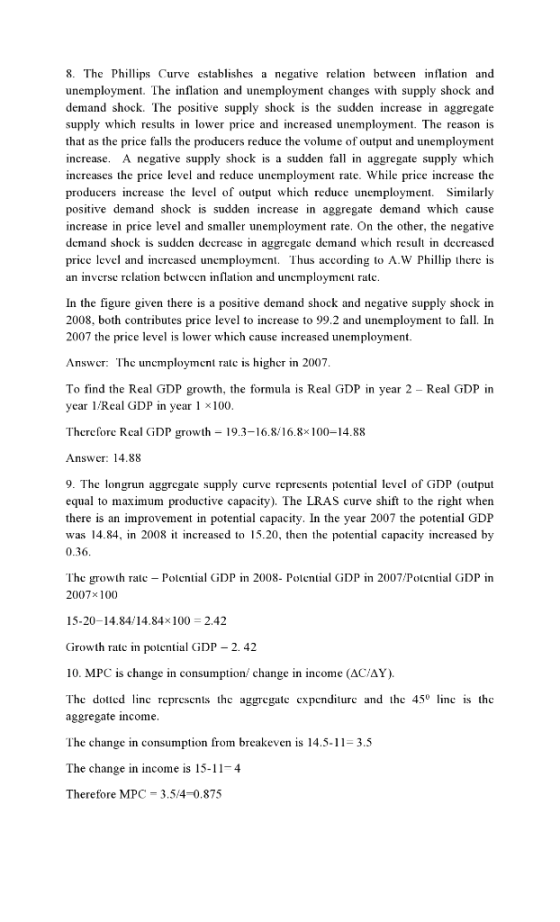
 Consider the information in the figure below for a hypothetical economy. What is the multiplier for this economy? Provide your answer rounded to two decimal places. Do not include any symbols, such as "S,""-," "% , " or ", in your answer. Expenditures and Output 14 13 12 apuada auda thy Consider the information in the figure below for a hypothetical economy. What is the marginal propensity to consume (MPC)? Provide your answer as a percentage rounded to two decimal...
With the onset of the 2007-2008 Great Recession, the Fed, led by Fed Chairman Ben Bernanke...
 With the onset of the 2007-2008 Great Recession, the Fed, led by Fed Chairman Ben Bernanke (2006- 2014), lowered its target interest rate (the federal funds rate) to a range of 0.00-0.25 percent. This was done with 7 rate cuts during 2008, after several in 2007. Consider the aggregate demand aggregate supply diagram below, which represents the macroeconomy. Suppose the market is initially at an equilibrium at point A. What effect will the Fed's actions have on this economy? LRAS:...
Question 33 (1 point) Suppose real GDP for an economy changes from $17.2 trillion to $20.9...
 Question 33 (1 point) Suppose real GDP for an economy changes from $17.2 trillion to $20.9 trillion. What is the rate of growth in real GDP? Provide your answer as a percent rounded to two decimal places. Do not include any symbols, such as "s,"' "' "%," or "," in your answer Your Answer: Answer
Here is some data on the economy: 2007 2008 Real GDP $1,300,000 $1,328,000 Populatio 12,227 12,838...
 Here is some data on the economy: 2007 2008 Real GDP $1,300,000 $1,328,000 Populatio 12,227 12,838 2009 $1,429,000 13,480 2010 $1,411,000 14,154 2) Calculate real GDP per capita 3) Calculate the growth rates for each year for real GDP and population. 4) Estimate the growth rates for each year for GDP per capita real using the growth rates from 3). Check your estimate by calculating the actual per capita growth rate. 5) Using the growth rates from 2008 to 2009,...
Consider an economy with the following aggregate demand (AD) and aggregate supply (AS) schedules. These schedules...
Consider an economy with the following aggregate demand (AD) and aggregate supply (AS) schedules. These schedules reflect the fact that, prior to the period we’re examining, decision makers entered into contracts and made choices anticipating that the price level would be P105. AD105 Price Level SRAS105 (trillion dollars) (trillion dollars) 5.1 95 3.5 4.9 100 3.8 4.7 105 4.2 4.5 110 4.5 4.3 115 4.8 The quantity of GDP that will be produced will be _____ trillion and the price...
Question 14 (1 point) Question 12 (1 point) Consider the following simplified balance sheet for a...
 Question 14 (1 point) Question 12 (1 point) Consider the following simplified balance sheet for a bank. Suppose the required reserve ratio decreases from 10 percent to 5 percent. By how much can the bank increase its loans? Provide your answer in dollars measured in thousands rounded to two decimal places. Do not include any symbols, such as "$", "%," or ","in your answer. Suppose the supply of money, measured by M1, is $3.0 trillion, output, measured by real GDP,...
14/1meinti Question 12 (1 point) Suppose the supply of money, measured by M1, is $3.0 trillion,...
 14/1meinti Question 12 (1 point) Suppose the supply of money, measured by M1, is $3.0 trillion, output, measured by real GDP, is $16.6 trillion, and the velocity of money is 6.5. Suppose the supply of money increases to $3.5 trillion but GDP and the velocity of money do not change. What is the percent by which prices change? Provide your answer as a percentage rounded to two decimal places. Do not include any symbols, such as "S, "," "% ,"...
The graph below depicts an economy where a decline in aggregate demandes caused a recession. This...
 The graph below depicts an economy where a decline in aggregate demandes caused a recession. This economy current level of real GDP (Y) is below its long-run equilibrium, which is illustrated by the long run aggregate supply curve LRASL and price level P. below the equilibrium value of Without any fiscal policy, we expect the economy to eventually return to full employment on its own. Use the graph below to the Instructions: Use the tool provided to plot New Curve...
Suppose the price level, as measured by the GDP deflator, is 1.08, the supply of money,...
Suppose the price level, as measured by the GDP deflator, is 1.08, the supply of money, measured by M1, is $3.6 trillion, and output, measured by real GDP, is $21.9 trillion. What is the velocity of money? Provide your answer as a number rounded to two decimal places. Do not include any symbols, such as "$," "=," "%," or "," in your answer.
 Consider the aggregate economy for the United States in 1929 and 1930, represented by the graph below. What is the rate of growth in real GDP, if any? Provide your answer as a percent rounded to two decimal places. Use a negative sign "-" for negative changes. Do not include any symbols, such as "S," ", "%," or "," in your answer. LRAS1929 SRASi LRAS1930 SRAS1929 Price level (GDP deflator, 2009 100) 10.6 10.2 AD1930 D1929 965.8 1005.6 1006.3 1094.1...
 Consider the information in the figure below for a hypothetical economy. What is the multiplier for this economy? Provide your answer rounded to two decimal places. Do not include any symbols, such as "S,""-," "% , " or ", in your answer. Expenditures and Output 14 13 12 apuada auda thy Consider the information in the figure below for a hypothetical economy. What is the marginal propensity to consume (MPC)? Provide your answer as a percentage rounded to two decimal...
 With the onset of the 2007-2008 Great Recession, the Fed, led by Fed Chairman Ben Bernanke (2006- 2014), lowered its target interest rate (the federal funds rate) to a range of 0.00-0.25 percent. This was done with 7 rate cuts during 2008, after several in 2007. Consider the aggregate demand aggregate supply diagram below, which represents the macroeconomy. Suppose the market is initially at an equilibrium at point A. What effect will the Fed's actions have on this economy? LRAS:...
 Question 33 (1 point) Suppose real GDP for an economy changes from $17.2 trillion to $20.9 trillion. What is the rate of growth in real GDP? Provide your answer as a percent rounded to two decimal places. Do not include any symbols, such as "s,"' "' "%," or "," in your answer Your Answer: Answer
 Here is some data on the economy: 2007 2008 Real GDP $1,300,000 $1,328,000 Populatio 12,227 12,838 2009 $1,429,000 13,480 2010 $1,411,000 14,154 2) Calculate real GDP per capita 3) Calculate the growth rates for each year for real GDP and population. 4) Estimate the growth rates for each year for GDP per capita real using the growth rates from 3). Check your estimate by calculating the actual per capita growth rate. 5) Using the growth rates from 2008 to 2009,...
 Question 14 (1 point) Question 12 (1 point) Consider the following simplified balance sheet for a bank. Suppose the required reserve ratio decreases from 10 percent to 5 percent. By how much can the bank increase its loans? Provide your answer in dollars measured in thousands rounded to two decimal places. Do not include any symbols, such as "$", "%," or ","in your answer. Suppose the supply of money, measured by M1, is $3.0 trillion, output, measured by real GDP,...
 14/1meinti Question 12 (1 point) Suppose the supply of money, measured by M1, is $3.0 trillion, output, measured by real GDP, is $16.6 trillion, and the velocity of money is 6.5. Suppose the supply of money increases to $3.5 trillion but GDP and the velocity of money do not change. What is the percent by which prices change? Provide your answer as a percentage rounded to two decimal places. Do not include any symbols, such as "S, "," "% ,"...
 The graph below depicts an economy where a decline in aggregate demandes caused a recession. This economy current level of real GDP (Y) is below its long-run equilibrium, which is illustrated by the long run aggregate supply curve LRASL and price level P. below the equilibrium value of Without any fiscal policy, we expect the economy to eventually return to full employment on its own. Use the graph below to the Instructions: Use the tool provided to plot New Curve...
Most questions answered within 3 hours.
-
please help with these two example, i want to double check my
work. thanks
1.
sum:=0...
asked 1 minute from now -
Patterson Development sometimes sells property on an installment
basis. In those cases, Patterson reports income in...
asked 1 minute ago -
in the formation of 1.0 mole of the following crystalline solids
from the gaseous ions most...
asked 4 minutes ago -
Please answer Letter G only.
Price
Quantity
TR
MR
MC
TC
Profit
$15,000
0
0
----...
asked 5 minutes ago -
You are required to develop and submit a 12-month integrated
marketing communications plan for the KFC...
asked 7 minutes ago -
Let v=(1,-4,12) and w=(3,5,-1) be vectors.
What is 2v-3w?
asked 23 minutes ago -
What is the [A2-] (in mol L-1) of a solution containing 1.355
mol L-1 of a...
asked 19 minutes ago -
Suppose an equilibrium mixture consists of 0.46 atm
N2O4 and 2.0 atm NO2, and the
volume...
asked 16 minutes ago -
9. Answer the following questions related to the size of a
program and memory space.
A)...
asked 20 minutes ago -
What organ is the site of gas exchange in amphibians? select
all that apply
spleen
lungs...
asked 21 minutes ago -
Function 4: my-map
In CLISP define your own function that duplicates the
functionality of mapcar from...
asked 49 minutes ago -
Imagine you are progressing very well
during your job interview and you are confidently prepared to...
asked 48 minutes ago