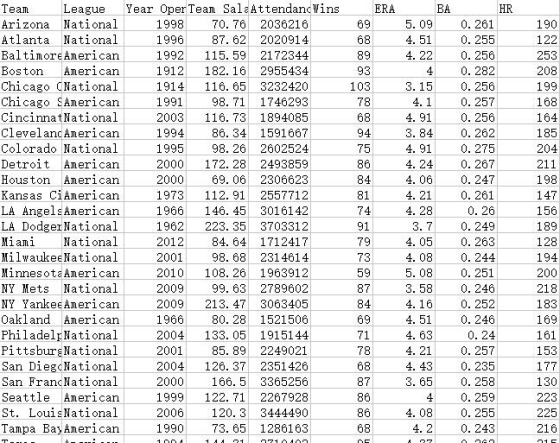
38. Refer to the Baseball 2016 data, which report information on the 30 Major League Baseball teams for the 2016 season.
| Texas | American | 1994 | 144.31 | 2710402 | 95 | 4.37 | 0.262 | 215 | 2016 | 4.40 |
| Toronto | American | 1989 | 112.90 | 3392299 | 89 | 3.78 | 0.248 | 221 | ||
| Washington | National | 2008 | 166.01 | 2481938 | 95 | 3.51 | 0.256 | 203 |
- At the .05 significance level, can we conclude that there is a difference in the mean salary of teams in the American League versus teams in the National League?
- At the .05 significance level, can we conclude that there is a difference in the mean home attendance of teams in the American League versus teams in the National League?
- Compute the mean and the standard deviation of the number of wins for the 10 teams with the highest salaries. Do the same for the 10 teams with the lowest salaries. At the .05 significance level, is there a difference in the mean attendance for the two groups?
Homework Answers
A)
To test the hypothesis for the difference in the mean salary of teams in the American League versus teams in the National League, the data values are arranged for for American and National team salary.
The data values for team salary are,
| American | National | |
| 115.59 | 70.76 | |
| 182.16 | 87.62 | |
| 98.71 | 116.65 | |
| 86.34 | 116.73 | |
| 172.25 | 98.26 | |
| 69.06 | 223.35 | |
| 112.91 | 84.64 | |
| 146.45 | 98.68 | |
| 108.26 | 99.63 | |
| 213.47 | 133.05 | |
| 80.25 | 85.89 | |
| 122.71 | 126.37 | |
| 73.65 | 166.5 | |
| 144.31 | 120.3 | |
| 112.9 | 166.01 | |
| Mean | 122.6013 | 119.6293 |
| N | 15 | 15 |
| Std Dev | 41.9987 | 40.01802 |
Two sample t test is used to compare the means assuming equal variance. The test is performed in following steps,
Step 1: The Null and Alternate Hypotheses are,


Step 2: Select the appropriate test statistic and level of significance.
The t statistic is used to compare the two population
means and the significance level is for the test  (Generally 5%
significance level used to compare two means)
(Generally 5%
significance level used to compare two means)
Step 3: State the decision rules.
The decision rules state the conditions that if,
 ,
,

Step 4: Compute the appropriate test statistic and make the decision.

Where pooled standard deviation is obtained using the formula,


Step 5: The P-value is obtained using the t distribution table for degree of freedom = n1+n2-2=30-2=28

Step 6: Conclusion
Since the corresponding P-value is 0.8441 which is greater than 0.05 at the 5% significance level for the two sided alternative hypothesis. Hence, it can be concluded that the null hypothesis is not rejected.
B)
The arranged data values for team attendance are,
| American | National | |
| 2172344 | 2036216 | |
| 2955434 | 2020914 | |
| 1746293 | 3232420 | |
| 1591667 | 1894085 | |
| 2493859 | 2602524 | |
| 2306623 | 3703312 | |
| 2557712 | 1712417 | |
| 3016142 | 2314614 | |
| 1963912 | 2789602 | |
| 3063405 | 1915144 | |
| 1521506 | 2249021 | |
| 2267928 | 2351426 | |
| 1286163 | 3365256 | |
| 2710402 | 3444490 | |
| 3392299 | 2481938 | |
| Mean | 2336379 | 2540892 |
| N | 15 | 15 |
| Std Dev | 629257 | 631793.4 |
Similarly,
Two sample t test is used to compare the means assuming equal variance.
Step 1: The Null and Alternate Hypotheses are,


Step 2: Select the appropriate test statistic and level of significance.
The t statistic is used to compare the two population
means and the significance level is for the test  (Generally 5%
significance level used to compare two means)
(Generally 5%
significance level used to compare two means)
Step 3: State the decision rules.
The decision rules state the conditions that if,
 ,
,

Step 4: Compute the appropriate test statistic and make the decision.

Where pooled standard deviation is obtained using the formula,


Step 5: The P-value is obtained using the t distribution table for degree of freedom = n1+n2-2=30-2=28

Step 6: Conclusion
Since the corresponding P-value is 0.38196 which is greater than 0.05 at the 5% significance level for the two sided alternative hypothesis. Hence, it can be concluded that the null hypothesis is not rejected.
C)
Now, arranging the data values of column wins with respect to the column team salary, the highest 10 and lowest 10 salaries are,
| Team Salary | Wins |
| 223.35 | 91 |
| 213.47 | 84 |
| 182.16 | 93 |
| 172.25 | 86 |
| 166.5 | 87 |
| 166.01 | 95 |
| 146.45 | 74 |
| 144.31 | 95 |
| 133.05 | 71 |
| 126.37 | 68 |
| 122.71 | 86 |
| 120.3 | 86 |
| 116.73 | 68 |
| 116.65 | 103 |
| 115.59 | 89 |
| 112.91 | 81 |
| 112.9 | 89 |
| 108.26 | 59 |
| 99.63 | 87 |
| 98.71 | 78 |
| 98.68 | 73 |
| 98.26 | 75 |
| 87.62 | 68 |
| 86.34 | 94 |
| 85.89 | 78 |
| 84.64 | 79 |
| 80.25 | 69 |
| 73.65 | 68 |
| 70.76 | 69 |
| 69.06 | 84 |
From these data values, the highest and lowest 10 values are,
| Highest 10 | Lowest 10 | |
| 91 | 73 | |
| 84 | 75 | |
| 93 | 68 | |
| 86 | 94 | |
| 87 | 78 | |
| 95 | 79 | |
| 74 | 69 | |
| 95 | 68 | |
| 71 | 69 | |
| 68 | 84 | |
| Mean | 84.4 | 75.7 |
| Std dev | 10.0466 | 8.4070 |
Two sample t test is used to compare the means assuming equal variance.
Step 1: The Null and Alternate Hypotheses are,


Step 2: Select the appropriate test statistic and level of significance.
The t statistic is used to compare the two population
means and the significance level is for the test  (Generally 5%
significance level used to compare two means)
(Generally 5%
significance level used to compare two means)
Step 3: State the decision rules.
The decision rules state the conditions that if,
 ,
,

Step 4: Compute the appropriate test statistic and make the decision.

Where pooled standard deviation is obtained using the formula,


Step 5: The P-value is obtained using the t distribution table for degree of freedom = n1+n2-2=20-2=18

Step 6: Conclusion
Since the corresponding P-value is 0.050077 which is greater than 0.05 at the 5% significance level for the two sided alternative hypothesis. Hence, it can be concluded that the null hypothesis is not rejected.
Add Answer to:
38. Refer to the Baseball 2016 data, which report information on the 30 Major League Baseball teams for the 2016 season....
Refer to the Baseball 2010 data, which report information on the 30 Major League Baseball teams...
Refer to the Baseball 2010 data, which report information on the 30 Major League Baseball teams for the 2010 season. c. compute the mean and the standard deviation of the number of wins for the 10 teams with the highest payrolls. do the same for the 10 teams with the lowest payrolls. at the .05 significance level, is there a difference in the mean number of wins for the two groups?
(6 points) The 30 Major League Baseball teams are divided into two "leagues" of 15 teams...
 (6 points) The 30 Major League Baseball teams are divided into two "leagues" of 15 teams each: the American League and the National League. A random sample of 46 American League players and a random sample of 46 National League players were selected. The sample mean and standard deviation of the salaries of the sampled players is shown in the table below. League Mean salary in millions USD SD of salary in millions USD American 5.716 7.489 National 6.149 8.896...
(6 points) The 30 Major League Baseball teams are divided into two "leagues" of 15 teams...
(6 points) The 30 Major League Baseball teams are divided into two "leagues" of 15 teams each: the American League and the National League. A random sample of 48 American League players and a random sample of 48 National League players were selected. The sample mean and standard deviation of the salaries of the sampled players is shown in the table below. League Mean salary in millions USD SD of salary in millions USD American 5.694 4.467 National 3.038 9.397...
he 30 Major League Baseball teams are divided into two "leagues" of 15 teams each: the...
he 30 Major League Baseball teams are divided into two "leagues" of 15 teams each: the American League and the National League. A random sample of 48 American League players and a random sample of 48 National League players were selected. The sample mean and standard deviation of the salaries of the sampled players is shown in the table below. League Mean salary in millions USD SD of salary in millions USD American 5.694 4.467 National 3.038 9.397 Note: The...
3) American League baseball teams play their games with the designated hitter rule, meaning that pitchers...
 3) American League baseball teams play their games with the designated hitter rule, meaning that pitchers do not bat. The league believes that replacing the pitcher, typically a weak hitter, with another player in the batting order produces more runs. Using a significance level of a = 0.05, determine if the average number of runs is higher for the American League Following are the average number of runs scored by each team in the 2016 season: American League National League...
please solve this problem using excel and show steps please D. and the standard deviation of...
 please solve this problem using excel and show steps
please
D. and the standard deviation of this distribution. 71. FILE Refer to the Baseball 2016 data. Compute the mean number of home runs per game. To do this, first find the mean number of home runs per team for 2016. Next, divide this value by 162 (a season comprises 162 games). Then multiply by 2 because there are two teams in each game. Use the Poisson distribution to estimate the...
please solve this problem using excel and show steps
please
D. and the standard deviation of this distribution. 71. FILE Refer to the Baseball 2016 data. Compute the mean number of home runs per game. To do this, first find the mean number of home runs per team for 2016. Next, divide this value by 162 (a season comprises 162 games). Then multiply by 2 because there are two teams in each game. Use the Poisson distribution to estimate the...
Team League Wins ERA BA HR SB Errors Built Size Attendance Payroll Pittsburgh Pirates NL 57...
Team League Wins ERA BA HR SB Errors Built Size Attendance Payroll Pittsburgh Pirates NL 57 5.00 0.242 126 87 127 2001 38496 1.61 34.9 San Diego Padres NL 90 3.39 0.246 132 124 72 2004 42445 2.13 37.8 Oakland Athletics AL 81 3.56 0.256 109 156 99 1966 34077 1.42 51.7 Texas Rangers AL 90 3.93 0.276 162 123 105 1994 49115 2.51 55.3 Florida Marlins NL 80 4.08 0.254 152 92 123 1987 36331 1.54 55.6 Arizona Diamondbacks...
Refer to the Lincolnville School District bus data. First, add a variable to change the type...
 Refer to the Lincolnville School District bus data. First, add a variable to change the type of engine (diesel or gasoline) to a qualitative variable. If the engine type is diesel, then set the qualitative variable to 0. If the engine type is gasoline, then set the qualitative variable to 1. Develop a regression equation using statistical software with maintenance cost as the dependent variable and age, odometer miles, miles since last maintenance, and engine type as the independent variables....
Hi it's python I imported a data which are so many words in txt and I arranged and reshaped with ...
 Hi it's python I imported a data which are so many words in txt
and I arranged and reshaped with alphabetically both rows and
columns
I was successful with these steps but I am stuck with next
step
below is my code and screenshot
import numpy as np
import pandas as pd
data=pd.read_csv("/Users/superman/Downloads/words_file2.txt",header=None)
df_input=pd.DataFrame(data)
df_output=pd.DataFrame(np.arange(676).reshape((26,26)),
index =
['a','b','c','d','e','f','g','h','i','j','k','l','m','n','o','p','q','r','s','t','u','v','w','x','y','z'],
columns =
['a','b','c','d','e','f','g','h','i','j','k','l','m','n','o','p','q','r','s','t','u','v','w','x','y','z'])
df_output.index.name="Start"
df_output.columns.name="End"
df_output
This below screen shot is what I have to find
I have to find each word...
Hi it's python I imported a data which are so many words in txt
and I arranged and reshaped with alphabetically both rows and
columns
I was successful with these steps but I am stuck with next
step
below is my code and screenshot
import numpy as np
import pandas as pd
data=pd.read_csv("/Users/superman/Downloads/words_file2.txt",header=None)
df_input=pd.DataFrame(data)
df_output=pd.DataFrame(np.arange(676).reshape((26,26)),
index =
['a','b','c','d','e','f','g','h','i','j','k','l','m','n','o','p','q','r','s','t','u','v','w','x','y','z'],
columns =
['a','b','c','d','e','f','g','h','i','j','k','l','m','n','o','p','q','r','s','t','u','v','w','x','y','z'])
df_output.index.name="Start"
df_output.columns.name="End"
df_output
This below screen shot is what I have to find
I have to find each word...
If the two signal handling functions in 3000pc were replaced by one function, would there be...
If the two signal handling functions in 3000pc were replaced by one function, would there be any significant loss of functionality? Briefly explain /* 3000pc.c */ 2 3 4 5 6 7 8 #include <stdio.h> 9 #include <stdlib.h> 10 #include <unistd.h> 11 #include <sys/mman.h> 12 #include <errno.h> 13 #include <string.h> 14 #include <sys/types.h> 15 #include <sys/wait.h> 16 #include <semaphore.h> 17 #include <string.h> 18 #include <time.h> 19 20 #define QUEUESIZE 32 21 #define WORDSIZE 16 22 23 const int wordlist_size =...
 (6 points) The 30 Major League Baseball teams are divided into two "leagues" of 15 teams each: the American League and the National League. A random sample of 46 American League players and a random sample of 46 National League players were selected. The sample mean and standard deviation of the salaries of the sampled players is shown in the table below. League Mean salary in millions USD SD of salary in millions USD American 5.716 7.489 National 6.149 8.896...
 3) American League baseball teams play their games with the designated hitter rule, meaning that pitchers do not bat. The league believes that replacing the pitcher, typically a weak hitter, with another player in the batting order produces more runs. Using a significance level of a = 0.05, determine if the average number of runs is higher for the American League Following are the average number of runs scored by each team in the 2016 season: American League National League...
 please solve this problem using excel and show steps
please
D. and the standard deviation of this distribution. 71. FILE Refer to the Baseball 2016 data. Compute the mean number of home runs per game. To do this, first find the mean number of home runs per team for 2016. Next, divide this value by 162 (a season comprises 162 games). Then multiply by 2 because there are two teams in each game. Use the Poisson distribution to estimate the...
please solve this problem using excel and show steps
please
D. and the standard deviation of this distribution. 71. FILE Refer to the Baseball 2016 data. Compute the mean number of home runs per game. To do this, first find the mean number of home runs per team for 2016. Next, divide this value by 162 (a season comprises 162 games). Then multiply by 2 because there are two teams in each game. Use the Poisson distribution to estimate the...
 Refer to the Lincolnville School District bus data. First, add a variable to change the type of engine (diesel or gasoline) to a qualitative variable. If the engine type is diesel, then set the qualitative variable to 0. If the engine type is gasoline, then set the qualitative variable to 1. Develop a regression equation using statistical software with maintenance cost as the dependent variable and age, odometer miles, miles since last maintenance, and engine type as the independent variables....
 Hi it's python I imported a data which are so many words in txt
and I arranged and reshaped with alphabetically both rows and
columns
I was successful with these steps but I am stuck with next
step
below is my code and screenshot
import numpy as np
import pandas as pd
data=pd.read_csv("/Users/superman/Downloads/words_file2.txt",header=None)
df_input=pd.DataFrame(data)
df_output=pd.DataFrame(np.arange(676).reshape((26,26)),
index =
['a','b','c','d','e','f','g','h','i','j','k','l','m','n','o','p','q','r','s','t','u','v','w','x','y','z'],
columns =
['a','b','c','d','e','f','g','h','i','j','k','l','m','n','o','p','q','r','s','t','u','v','w','x','y','z'])
df_output.index.name="Start"
df_output.columns.name="End"
df_output
This below screen shot is what I have to find
I have to find each word...
Hi it's python I imported a data which are so many words in txt
and I arranged and reshaped with alphabetically both rows and
columns
I was successful with these steps but I am stuck with next
step
below is my code and screenshot
import numpy as np
import pandas as pd
data=pd.read_csv("/Users/superman/Downloads/words_file2.txt",header=None)
df_input=pd.DataFrame(data)
df_output=pd.DataFrame(np.arange(676).reshape((26,26)),
index =
['a','b','c','d','e','f','g','h','i','j','k','l','m','n','o','p','q','r','s','t','u','v','w','x','y','z'],
columns =
['a','b','c','d','e','f','g','h','i','j','k','l','m','n','o','p','q','r','s','t','u','v','w','x','y','z'])
df_output.index.name="Start"
df_output.columns.name="End"
df_output
This below screen shot is what I have to find
I have to find each word...
Most questions answered within 3 hours.
-
A battery has an
internal resistance of 0.20 Ώ. A number of 3 identical light bulbs,...
asked 20 minutes ago -
German cheese producer has recently expanded its business
activities to Norway and Denmark. Local subsidiaries of...
asked 14 minutes ago -
Below is the Netbeans source code of an Abstract factory
project,
Using the code in netbeans,...
asked 17 minutes ago -
I'm trying to make a recursive binary search that checks whether
or not the words in...
asked 20 minutes ago -
an
entrepreneur has been primarily associated with the willingness to
A)
possess a government job
b)...
asked 23 minutes ago -
Write
down your solution for this assignment, take a picture and submit
on canvas. Typed answers...
asked 24 minutes ago -
Draw the molecules from the IUPAC names:
a)(2S)-2bromo-4-methylhexane
b)(R,E)-6-aminohept-2-en-4-one
c)(1R,3R)-3-methylcyclopentane-1-ol
d)(2S,3S)-2,3-dihydroxysuccinic and
asked 34 minutes ago -
A piston-cylinder assembly contains 0.5 kg of water. Initially,
the piston is resting against the stops...
asked 37 minutes ago -
A first-order reaction has a rate constant of 1.35 x 10² s-1 at
25.0 oC (298...
asked 44 minutes ago -
At what velocity (in revolutions per minute) will the peak
voltage of a generator be 485...
asked 1 hour ago -
Solve the problem.
The events A and B are mutually exclusive. If P(A) = 0.1 and...
asked 1 hour ago -
QUESTION 7
A. If you were doing a study on an orange species, and
a brown...
asked 1 hour ago