
Homework Answers


Add Answer to:
3- The figure given below shows the one line diagram of a simple power system. Line impedançe is given in per unit...
3. Figure 3, shows the one-line diagram of a simple three-bus power system with generation at buses 1 and 3. The voltag...
 Figure 3, shows the one-line diagram of a simple three-bus power system with generation at buses 1 and 3 . The voltage at bus 1 is \(V_{1}=1.025 \angle 0^{\circ}\) per unit. Voltage magnitude at bus 3 is fixed at \(1.03\) pu with a real power generation of \(300 \mathrm{MW}\). A load consisting of \(400 \mathrm{MW}\) and \(200 \mathrm{Mvar}\) is taken from bus 2. Line impedances are marked in per unit on a 100-MVA base. For the purpose of hand calculations,...
Q2. (40) Eig. 1 shows the one-line diagram of a simple three-bus power system with generation at bus 1. The magnitude of voltage at bus 1 is adjusted to 1.05 pu. The scheduled loads at buses 2 and 3...
 Q2. (40) Eig. 1 shows the one-line diagram of a simple three-bus power system with generation at bus 1. The magnitude of voltage at bus 1 is adjusted to 1.05 pu. The scheduled loads at buses 2 and 3 are as marked on the diagram. Line imepdances are marked in pu on a 100 MVA base and the line charging susceptances are neglected a) (30) Using the GS (Gauss-Seidael) method, voltage phasors at the load buses 2 and 3 (P-Q...
A generator bus(with 1.0 per unit voltage)supplies a 180MW, 60Mvar load through a lossless transmission line...
A generator bus(with 1.0 per unit voltage)supplies a 180MW, 60Mvar load through a lossless transmission line with per unit (100 MVA base) impedance of j0.1 and no line charging. Starting with an initial voltage guess of 0.8<0◦,iterate until converged using the Newton-Raphson power flow method. For a convergence criteria, use a maximum power flow mismatch of 0.1 MVA.
1. In the power system network shown in Figure 1, Vi bus 1 is a slack bus with 1.00 per unit and bus 2 is a load bus wi...
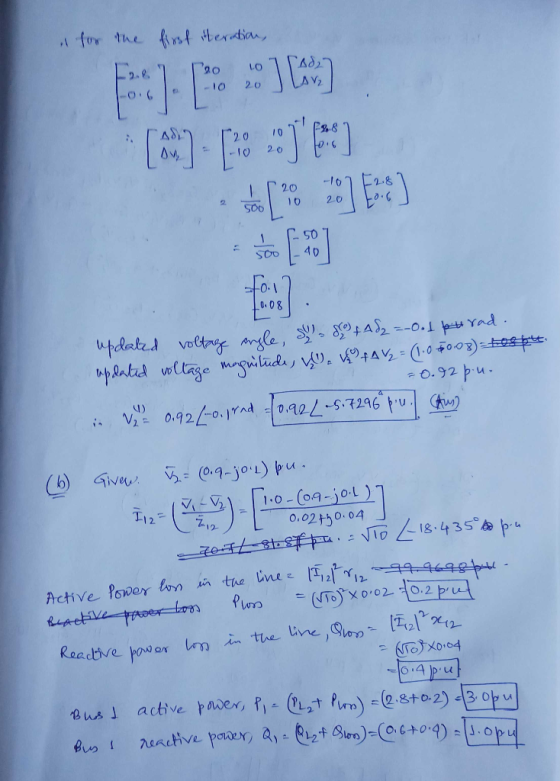
 1. In the power system network shown in Figure 1, Vi bus 1 is a slack bus with 1.00 per unit and bus 2 is a load bus with S2 Mvar. The line impedance on a base of 100 MVA is Z = 0.02 + j0.04 per unit (a) Using Gauss-Seidel method, determine V2 . Use an initial estimate of V=1.0j0.0 and perform four iterations (b) If after several iterations voltage at bus 2 converges to V2 = 0.90-j0.10, determine...
Figure 1 shows the one line diagram of a simple power system. Generators are connected at...
 Figure 1 shows the one line diagram of a simple power system. Generators are connected at buses 1 and 3 while the loads are indicated at all five buses. Base values for transmission system are 100 MVA, 138 kV. The line data of Table 1 gives per unit series impedances and the charging MVar accounting for the distributed capacitance of the 5 lines. The bus data in Table 2 list values for P, Q and Vat each bus. The slack...
The single line diagram of a simple power system is shown in Figure 1. The system...
 The single line diagram of a simple power system is shown in Figure 1. The system data are given in the table below. Choose a base power of 100 MVA and a base voltage of 132kV in Line4. Draw the impedance diagram of the system. Calculate and mark all impedances in pu on the diagram. Calculate the line to line voltage of Bus 3 in pu and in kV if the motor draws its rated power at rated voltage and...
Question 1: A single line diagram of a three-bus power system is shown in Fig 1....
 Question 1: A single line diagram of a three-bus power system is shown in Fig 1. Bus 1 is the slack bus with a voltage of 1.020 per unit, bus 2 is a voltage-controlled bus (PV-bus) with a voltage magnitude of 1.05 pu and real generated power of 1 00 MWand the reactive power in the range Q.(20MVAR) < Q<Q-60M¥AR .BUS 3 is PQ bus with P 300 MW and Q= 200 Mvar. Take 100 MVÅ susceptance are neglected as...
The one-line diagram of a simple power system is shown in Figure 1. The neutral of...
 The one-line diagram of a simple power system is shown in Figure 1. The neutral of each generator is grounded through a current-limiting reactor of 0.25/3 per unit on a 100-MVA base. The system data expressed in per unit on a common 100-MVA base is tabulated below. The generators are running on no-load at their rated voltage and rated frequency with their emfs in phase. Determine the fault current for the following faults giving Zo = 0.35, Z = 0.22...
Q2) For the three bus power system shown below, use the NR power flow to determine the only first...
 USING NEWTON RAPHSON
Q2) For the three bus power system shown below, use the NR power flow to determine the only first iteration voltage magnitude and angle at bus 2 and bus 3. Assume that SB 100 MVA Bus 1 Bus 2 s3.85 1.90 22.36 2.0331.62 [1.89 31.62 1.89 40 W258.13 1.10 5.7/20s Gen 58.131-1.1035.772.03 31.62 1.89 35.772.03 67.231.17 250 MVr Bus Slack Bus V10510 pu Bus 3 Gen V3-1.04 pu p- 200 Mw 2 1 211 11 + i...
USING NEWTON RAPHSON
Q2) For the three bus power system shown below, use the NR power flow to determine the only first iteration voltage magnitude and angle at bus 2 and bus 3. Assume that SB 100 MVA Bus 1 Bus 2 s3.85 1.90 22.36 2.0331.62 [1.89 31.62 1.89 40 W258.13 1.10 5.7/20s Gen 58.131-1.1035.772.03 31.62 1.89 35.772.03 67.231.17 250 MVr Bus Slack Bus V10510 pu Bus 3 Gen V3-1.04 pu p- 200 Mw 2 1 211 11 + i...
Problem 2 (50 Points) A generator bus (with a 1.0 per unit voltage) supplies a 180...
 Problem 2 (50 Points) A generator bus (with a 1.0 per unit voltage) supplies a 180 MW, 60 MVar load through a lossless transmission line with per unit (100 MVA base) impedance of j0.1 and no line charging. Starting with an initial voltage guess of 1.020° (flat start), iterate until converged using the Newton-Raphson power flow method. For convergence criteria, use a maximum power flow mismatch of 0.1 MVA
 Figure 3, shows the one-line diagram of a simple three-bus power system with generation at buses 1 and 3 . The voltage at bus 1 is \(V_{1}=1.025 \angle 0^{\circ}\) per unit. Voltage magnitude at bus 3 is fixed at \(1.03\) pu with a real power generation of \(300 \mathrm{MW}\). A load consisting of \(400 \mathrm{MW}\) and \(200 \mathrm{Mvar}\) is taken from bus 2. Line impedances are marked in per unit on a 100-MVA base. For the purpose of hand calculations,...
 Q2. (40) Eig. 1 shows the one-line diagram of a simple three-bus power system with generation at bus 1. The magnitude of voltage at bus 1 is adjusted to 1.05 pu. The scheduled loads at buses 2 and 3 are as marked on the diagram. Line imepdances are marked in pu on a 100 MVA base and the line charging susceptances are neglected a) (30) Using the GS (Gauss-Seidael) method, voltage phasors at the load buses 2 and 3 (P-Q...
 1. In the power system network shown in Figure 1, Vi bus 1 is a slack bus with 1.00 per unit and bus 2 is a load bus with S2 Mvar. The line impedance on a base of 100 MVA is Z = 0.02 + j0.04 per unit (a) Using Gauss-Seidel method, determine V2 . Use an initial estimate of V=1.0j0.0 and perform four iterations (b) If after several iterations voltage at bus 2 converges to V2 = 0.90-j0.10, determine...
 Figure 1 shows the one line diagram of a simple power system. Generators are connected at buses 1 and 3 while the loads are indicated at all five buses. Base values for transmission system are 100 MVA, 138 kV. The line data of Table 1 gives per unit series impedances and the charging MVar accounting for the distributed capacitance of the 5 lines. The bus data in Table 2 list values for P, Q and Vat each bus. The slack...
 The single line diagram of a simple power system is shown in Figure 1. The system data are given in the table below. Choose a base power of 100 MVA and a base voltage of 132kV in Line4. Draw the impedance diagram of the system. Calculate and mark all impedances in pu on the diagram. Calculate the line to line voltage of Bus 3 in pu and in kV if the motor draws its rated power at rated voltage and...
 Question 1: A single line diagram of a three-bus power system is shown in Fig 1. Bus 1 is the slack bus with a voltage of 1.020 per unit, bus 2 is a voltage-controlled bus (PV-bus) with a voltage magnitude of 1.05 pu and real generated power of 1 00 MWand the reactive power in the range Q.(20MVAR) < Q<Q-60M¥AR .BUS 3 is PQ bus with P 300 MW and Q= 200 Mvar. Take 100 MVÅ susceptance are neglected as...
 The one-line diagram of a simple power system is shown in Figure 1. The neutral of each generator is grounded through a current-limiting reactor of 0.25/3 per unit on a 100-MVA base. The system data expressed in per unit on a common 100-MVA base is tabulated below. The generators are running on no-load at their rated voltage and rated frequency with their emfs in phase. Determine the fault current for the following faults giving Zo = 0.35, Z = 0.22...
 USING NEWTON RAPHSON
Q2) For the three bus power system shown below, use the NR power flow to determine the only first iteration voltage magnitude and angle at bus 2 and bus 3. Assume that SB 100 MVA Bus 1 Bus 2 s3.85 1.90 22.36 2.0331.62 [1.89 31.62 1.89 40 W258.13 1.10 5.7/20s Gen 58.131-1.1035.772.03 31.62 1.89 35.772.03 67.231.17 250 MVr Bus Slack Bus V10510 pu Bus 3 Gen V3-1.04 pu p- 200 Mw 2 1 211 11 + i...
USING NEWTON RAPHSON
Q2) For the three bus power system shown below, use the NR power flow to determine the only first iteration voltage magnitude and angle at bus 2 and bus 3. Assume that SB 100 MVA Bus 1 Bus 2 s3.85 1.90 22.36 2.0331.62 [1.89 31.62 1.89 40 W258.13 1.10 5.7/20s Gen 58.131-1.1035.772.03 31.62 1.89 35.772.03 67.231.17 250 MVr Bus Slack Bus V10510 pu Bus 3 Gen V3-1.04 pu p- 200 Mw 2 1 211 11 + i...
 Problem 2 (50 Points) A generator bus (with a 1.0 per unit voltage) supplies a 180 MW, 60 MVar load through a lossless transmission line with per unit (100 MVA base) impedance of j0.1 and no line charging. Starting with an initial voltage guess of 1.020° (flat start), iterate until converged using the Newton-Raphson power flow method. For convergence criteria, use a maximum power flow mismatch of 0.1 MVA
Most questions answered within 3 hours.
-
If you’re standing at the bottom of a hill and asked to evaluate
it while being...
asked 35 minutes ago -
1. Which region has taken the lead in the world of
e-waste handling?
a) European Union...
asked 29 minutes ago -
A 8.15- g bullet from a 9-mm pistol has a velocity of 366.0 m/s.
It strikes...
asked 2 hours ago -
The outstanding bonds of Alpha Extracts have a yield to maturity
of 7.4 percent and a...
asked 1 hour ago -
The Problem: The Case of the Harmonizing Vacations
Your CEO is exploring partnering with a European...
asked 3 hours ago -
A chemical equation is balanced by adding coefficients in front
of some formulas so that the...
asked 3 hours ago -
From the literature (reference your sources): What are the
lattice parameters of calcite and aragonite? Why...
asked 4 hours ago -
Your system is rejecting the question am asking which is
preceded by a case study. It...
asked 4 hours ago -
3. On January 2, 2000, Larry creates a trust with himself as
trustee. Larry as trustee...
asked 4 hours ago -
A member of the volleyball team spikes the ball. During this
process, she changes the velocity...
asked 4 hours ago -
Are adult gamers less likely to use a gaming console (Xbox,
PlayStation, Wii, etc...) than teen...
asked 5 hours ago -
The University of
Texas recently reported that 43% of college students aged 18-24
would spend their...
asked 5 hours ago