

please help me answer the all question ..thanks a lot
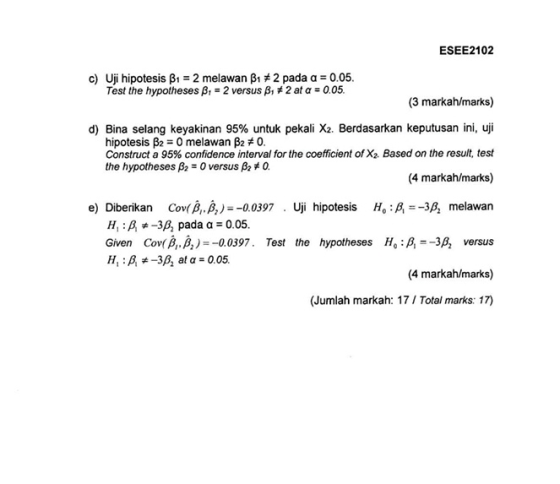
ESEE2102 Uji hipotesis β1-2 melawan β1 #2 pada α :0.05 c) Test the hypotheses β1-2 versus β:1 2 at α-0.05. (3 markah/marks) d) Bina selang keyakinan 95% untuk pekali X2. Berdasarkan keputusan ini, uji hipotesis β2 = 0 melawan β. 0. Construct a 95% confidence interval for the coefficient of X2. Based on the result, test the hypotheses β,-0 versus β. 0. (4 markah/marks) . Uji hipotesis Ho:A -за melawan e) Diberikan Coy(B.A)s-00397 Ho:A -3A Test Given Cov(βί.A)--0.0397. H,:A*-3A at α-0.05. the hypotheses versus (4 markah/marks) (Jumlah markah: 17 Total marks: 17)
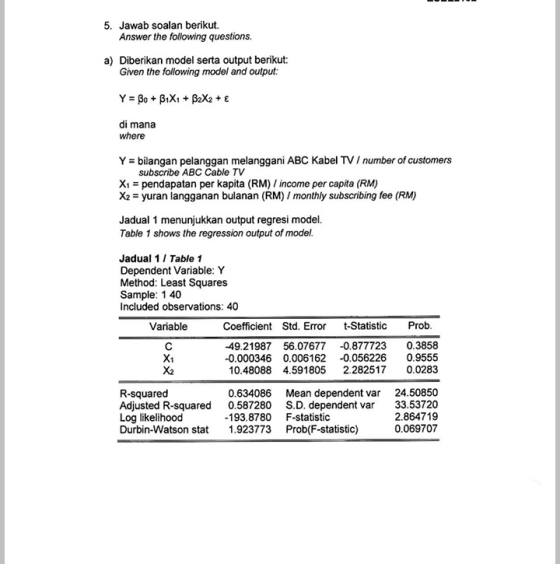
5. Jawab soalan berikut. Answer the following questions. a) Diberikan model serta output berikut: Given the following model and output: di mana where Y- bilangan pelanggan melanggani ABC Kabel TV I number of customers subscribe ABC Cable TV Xi- pendapatan per kapita (RM) / income per capita (RM) X2- yuran langganan bulanan (RM) / monthly subscribing fee (RM) Jadual 1 menunjukkan output regresi model. Table 1 shows the regression output of model. Jadual 1/ Table 1 Dependent Variable: Y Method: Least Squares Sample: 1 40 Included observations: 40 Coefficient Std. Error t-Statistic Prob Variable -49.21987 56.07677 -0.877723 0.3858 0.000346 0.006162 -0.056226 0.9555 10.48088 4.591805 2.282517 0.0283 X1 X2 0.634086 Mean dependent var 24.50850 Adjusted R-squared 0.587280 S.D. dependent var 33.53720 2.864719 0.069707 R-squared 193.8780 F-statistic Log likelihood Durbin-Watson stat 1.923773 Prob(F-statistic)
Jadual 2 menunjukkan output ujian White yang telah dijalankan ke atas model itu Table 2 shows the White test conducted on the model. Jadual 21 Table 2 Dependent Variable: RESID2 Method: Least Squares Sample: 1 40 Included observations: 40 Variable Coefficient Std. Error t-Statistic Prob 33633.10 39286.98 -0.856088 0.3979 3.955417 8.421005 0.469708 0.6416 3852.628 5467.530 0.704638 0.4858 2.23E-05 0.000572 0.039098 0.9690 190.6436 290.8971 0.655365 0.5166 0.626635 0.576808 1.086385 0.2850 X2 X1A2 X22 XiX2 R-squared Adjusted R-squared Log likelihood Durbin-Watson stat 0.666847Mean dependent var 949.5825 0.544324 S.D. dependent var 2753.343 -369.4233 F-statistic 2.265359 1.361763 0.263010 Prob(F-statistic) i) Berdasarkan Jadual 2, adakah masalah heteroskedastisiti wujud di model ini? Gunakan ujian White pada a 0.05 Based on Table 2, does the problem of heteroscedasticity exist? Use White test at a 0.05 i) Cadangkan satu cara untuk mengatasi masalah heteroskedastisiti Suggest a way to mitigate the problem of heteroscedasticity (6 markah/marks) b) Diberikan model berikut berdasarkan data tahunan selama 30 tahun: Given the following model based on a 30-year annual data set Y 4.73+1.92X,+1.15x R 0.6175; Durbin-Watson: d-2.8783 i) Dengan ujian Durbin-Watson, apakah kesimpulan yang anda boleh buat mengenai ralat model ini? Uji pada 0.05 With a Durbin-Watson test, what conclusion would you draw about the residuals of the model? Test at a 0.05.
ESEE2102 Kemudian, anda ingin menguji autokorelasi peringkat kedua berdasarkan model berikut: Then, you want to test for second order autocorrelation based on the following model: e, 1.58+1.13X, +2.04X, +0.98e--0.34e R-0.2954 Durbin-Watson: d 1.7128 ii) Dengan ujian Breusch-Godfrey LM, adakah wujud autokorelasi peringkat kedua dalam model ini pada a0.05? With a Breusch-Godfrey LM test, is there second order autocorrelation in the model at a 0.05? (7 markah/marks) c) Bilakah anda menggunakan ujian RESET? When do you use RESET test? (1 markah/mark) d) Bilakah anda menggunakan ujian Jarque-Bera? When do you use Jarque-Bera test? (1 markah/mark) (Jumlah markah: 15 Total marks: 15)
Homework Answers
a)
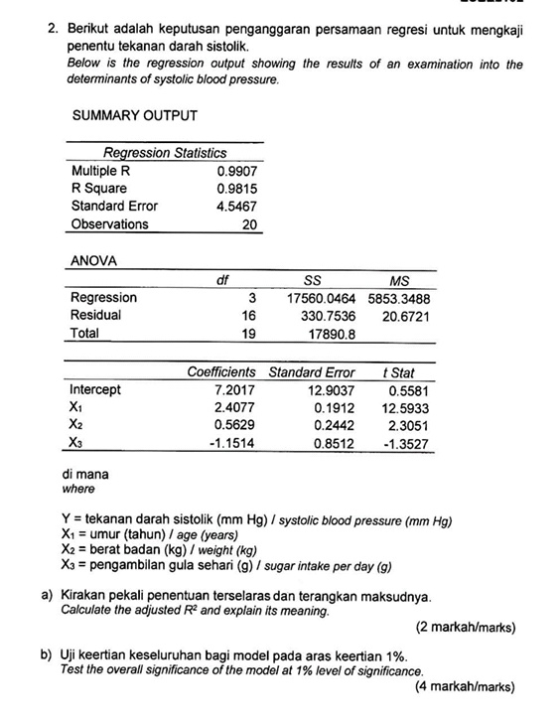
adjusted R^2 formula = 1 - (1- R^2)(n-1)/(n-k-1)
= 1 - (1 - 0.9815)(19/16)
= 0.97803125
The adjusted R2 tells you the percentage of variation explained
by only the independent variables that actually affect the
dependent variable.
b)
F = MS regression / MS error
= 5853.3488/20.6721
= 283.1521
p-value = f.dist.rt( 283.1521,3,16)
= 0.0000
p-value < alpha (0.01)
hence we reject the null hypothesis
we conclude that the model is significant
c)
TS = (b^ - 2)/se(b^)
= (2.4077 - 2)/0.1912
= 2.13232
critical value at 0.05 alpha
= t.inv.2t(0.05,16)
=2.1199
since TS > critical value
we reject the null hypothesis
d)
95% confidence interval
(b^ - t * se , b^ + t * se)
t = 2.1199
b2^ = 0.5629
se = 0.2442
hence
(0.5629 - 2.1199* 0.2442 , 0.5629 + 2.1199* 0.2442 )
= ( 0.04522 , 1.080579)
Add Answer to:
please help me answer the all question ..thanks a lot 2. Berikut adalah keputusan penganggaran persamaan regresi untuk...
Question 2 Untuk terus berdaya saing, syarikat pembekal untuk sebuah syarikat semikonduktor terkemuka perlu melabur untuk...
 Question 2 Untuk terus berdaya saing, syarikat pembekal untuk sebuah syarikat semikonduktor terkemuka perlu melabur untuk platform 'big data'. Anggaran ekonomi untuk setiap pakej ditunjukkan dalam Jadual Q2 di bawah. To remain competitive, a supplier for a huge semiconductor company has to invest for a big data platform. The economic estimates for each package are shown in Table Q2 below Jadual S2/Table Q2 Pakei Package Pelaburan permulaan Initial investment Penerimaan tahunan Annual receipts Perbelanjaan tahunarn Annual expenses Jangka hayat (tahun)...
Pada 31 Disember 2017, Mahligai Berhad mempunyai baki aset loji dan susut nilai terkumpul adalah seperti...
 Pada 31 Disember 2017, Mahligai Berhad mempunyai baki aset loji dan susut nilai terkumpul adalah seperti berikut: At 31 December 2017, Mahligai Berhad's plant asset and accumulated depreciation accounts had the following balances: Aset bukan semasal Non- current Assets Nilai/Value Susut nilai terkumpull Accumulated depreciation RM RM Kaedah susut Hayat nilail bergunal Depreciation Useful life method Tahun/Years Tanah/Land 175,000 Bangunan/Buildings 1,500,000 240,000 Jentera/Machinery 1,125,000 225,000 Garis Lurus Straight line Garis Lurus Straight line Garis Lurus Straight line 10 Paten/Patent 500,000...
answer QS 2,thank, 2. (a) Dalam sampel rawak 200 orang lelaki, 54 menyatakan bahawa mereka menggunakan kad kredit da...
 answer QS 2,thank,
2. (a) Dalam sampel rawak 200 orang lelaki, 54 menyatakan bahawa mereka menggunakan kad kredit dan, dalam sampel 160 orang wanita, 56 daripadanya menggunakan kad kredit. Pada aras keertian 0.01, adakah terdapat perbezaan yang bererti di antara kadar lelaki berbanding wanita yang menggunakan kad kredit? In a random sample of 200 men, 54 indicated they are using credit cards and, in sample of 160 women, 56 indicated of using credit cards. At the 0.01 level of significance,...
answer QS 2,thank,
2. (a) Dalam sampel rawak 200 orang lelaki, 54 menyatakan bahawa mereka menggunakan kad kredit dan, dalam sampel 160 orang wanita, 56 daripadanya menggunakan kad kredit. Pada aras keertian 0.01, adakah terdapat perbezaan yang bererti di antara kadar lelaki berbanding wanita yang menggunakan kad kredit? In a random sample of 200 men, 54 indicated they are using credit cards and, in sample of 160 women, 56 indicated of using credit cards. At the 0.01 level of significance,...
OP Please help me with the question above. Take Home Assignment 4 (***Round all the answers...
 OP
Please help me with the question above.
Take Home Assignment 4 (***Round all the answers and intermediate calculations to two decimal places**) Question 1 (100 Marks) The following table is the regression results from the econometric mixtel: LOG(SALES) = 8. + S_LOG (PRICE) + ADVERT +e For a sample of 66 observations SALES: Monthly Sales of product A (S1000) PRICE: A price Index of product (51) ADVERT: Adverting Expenditure on product A (S1000) Dependent Variable: LOGSALES Method: Least Squares...
OP
Please help me with the question above.
Take Home Assignment 4 (***Round all the answers and intermediate calculations to two decimal places**) Question 1 (100 Marks) The following table is the regression results from the econometric mixtel: LOG(SALES) = 8. + S_LOG (PRICE) + ADVERT +e For a sample of 66 observations SALES: Monthly Sales of product A (S1000) PRICE: A price Index of product (51) ADVERT: Adverting Expenditure on product A (S1000) Dependent Variable: LOGSALES Method: Least Squares...
Question 1 You are interested in studying the effect of the US minimum Rico. Therefore you...
 Question 1 You are interested in studying the effect of the US minimum Rico. Therefore you use the following dataset wage on employment in Puerto Variable LPREPOP Log of the Puerto Rican employment per capita LMINCOVLog of the minimum wage relative to average wages Description time trend (1 to 38) LUSGNP Log of US gross national product a) Explain what autocorrelation is. Provide an example which illustrates the regression problem, and describe a method that can be used to reduce...
Please answer all parts, use question #2 to solve #3. 2. For a random sample of...
 Please answer all parts, use question #2 to solve #3.
2. For a random sample of size n = 25, the correlation is r = 0.31 for normal random variables X and Y. Answer the questions for the hypothesis test. Use a level of significance of a = 0.08. Ho: p= 0 H1: p0 a. The critical value is Z = b. The test statistic is Z = C. The p-value is d. The hypothesis (should, should not) be rejected....
Please answer all parts, use question #2 to solve #3.
2. For a random sample of size n = 25, the correlation is r = 0.31 for normal random variables X and Y. Answer the questions for the hypothesis test. Use a level of significance of a = 0.08. Ho: p= 0 H1: p0 a. The critical value is Z = b. The test statistic is Z = C. The p-value is d. The hypothesis (should, should not) be rejected....
 Question 2 Untuk terus berdaya saing, syarikat pembekal untuk sebuah syarikat semikonduktor terkemuka perlu melabur untuk platform 'big data'. Anggaran ekonomi untuk setiap pakej ditunjukkan dalam Jadual Q2 di bawah. To remain competitive, a supplier for a huge semiconductor company has to invest for a big data platform. The economic estimates for each package are shown in Table Q2 below Jadual S2/Table Q2 Pakei Package Pelaburan permulaan Initial investment Penerimaan tahunan Annual receipts Perbelanjaan tahunarn Annual expenses Jangka hayat (tahun)...
 Pada 31 Disember 2017, Mahligai Berhad mempunyai baki aset loji dan susut nilai terkumpul adalah seperti berikut: At 31 December 2017, Mahligai Berhad's plant asset and accumulated depreciation accounts had the following balances: Aset bukan semasal Non- current Assets Nilai/Value Susut nilai terkumpull Accumulated depreciation RM RM Kaedah susut Hayat nilail bergunal Depreciation Useful life method Tahun/Years Tanah/Land 175,000 Bangunan/Buildings 1,500,000 240,000 Jentera/Machinery 1,125,000 225,000 Garis Lurus Straight line Garis Lurus Straight line Garis Lurus Straight line 10 Paten/Patent 500,000...
 answer QS 2,thank,
2. (a) Dalam sampel rawak 200 orang lelaki, 54 menyatakan bahawa mereka menggunakan kad kredit dan, dalam sampel 160 orang wanita, 56 daripadanya menggunakan kad kredit. Pada aras keertian 0.01, adakah terdapat perbezaan yang bererti di antara kadar lelaki berbanding wanita yang menggunakan kad kredit? In a random sample of 200 men, 54 indicated they are using credit cards and, in sample of 160 women, 56 indicated of using credit cards. At the 0.01 level of significance,...
answer QS 2,thank,
2. (a) Dalam sampel rawak 200 orang lelaki, 54 menyatakan bahawa mereka menggunakan kad kredit dan, dalam sampel 160 orang wanita, 56 daripadanya menggunakan kad kredit. Pada aras keertian 0.01, adakah terdapat perbezaan yang bererti di antara kadar lelaki berbanding wanita yang menggunakan kad kredit? In a random sample of 200 men, 54 indicated they are using credit cards and, in sample of 160 women, 56 indicated of using credit cards. At the 0.01 level of significance,...
 OP
Please help me with the question above.
Take Home Assignment 4 (***Round all the answers and intermediate calculations to two decimal places**) Question 1 (100 Marks) The following table is the regression results from the econometric mixtel: LOG(SALES) = 8. + S_LOG (PRICE) + ADVERT +e For a sample of 66 observations SALES: Monthly Sales of product A (S1000) PRICE: A price Index of product (51) ADVERT: Adverting Expenditure on product A (S1000) Dependent Variable: LOGSALES Method: Least Squares...
OP
Please help me with the question above.
Take Home Assignment 4 (***Round all the answers and intermediate calculations to two decimal places**) Question 1 (100 Marks) The following table is the regression results from the econometric mixtel: LOG(SALES) = 8. + S_LOG (PRICE) + ADVERT +e For a sample of 66 observations SALES: Monthly Sales of product A (S1000) PRICE: A price Index of product (51) ADVERT: Adverting Expenditure on product A (S1000) Dependent Variable: LOGSALES Method: Least Squares...
 Question 1 You are interested in studying the effect of the US minimum Rico. Therefore you use the following dataset wage on employment in Puerto Variable LPREPOP Log of the Puerto Rican employment per capita LMINCOVLog of the minimum wage relative to average wages Description time trend (1 to 38) LUSGNP Log of US gross national product a) Explain what autocorrelation is. Provide an example which illustrates the regression problem, and describe a method that can be used to reduce...
 Please answer all parts, use question #2 to solve #3.
2. For a random sample of size n = 25, the correlation is r = 0.31 for normal random variables X and Y. Answer the questions for the hypothesis test. Use a level of significance of a = 0.08. Ho: p= 0 H1: p0 a. The critical value is Z = b. The test statistic is Z = C. The p-value is d. The hypothesis (should, should not) be rejected....
Please answer all parts, use question #2 to solve #3.
2. For a random sample of size n = 25, the correlation is r = 0.31 for normal random variables X and Y. Answer the questions for the hypothesis test. Use a level of significance of a = 0.08. Ho: p= 0 H1: p0 a. The critical value is Z = b. The test statistic is Z = C. The p-value is d. The hypothesis (should, should not) be rejected....
Most questions answered within 3 hours.
-
The time married men with children spend on child care averages
5.9 hours per week (Time,...
asked 8 minutes ago -
There are many minerals which contain sliver. One of them,
smithite, is placed in water and...
asked 6 minutes ago -
The chickens at Colonel Thompson's Ranch have a mean weight of
1850 g, with a standard...
asked 3 minutes ago -
22.3 g of fructose, C6H12O6,
are dissolved completely in 75.5 mL of pure water at 20.0...
asked 29 minutes ago -
Two bankrobbers are standing side by side, trying to push open
the door of a safe...
asked 30 minutes ago -
2. You want to buy a house. You can make an initial payment of
$200,000 and...
asked 27 minutes ago -
Why study the ‘Economic environment’ of a country? Describe the
information you will be collecting in...
asked 18 minutes ago -
A chandelier with mass m is suspended from a cable with mass M
from the ceiling....
asked 27 minutes ago -
How many disk accesses are needed to bring byte i of a file
into memory when...
asked 31 minutes ago -
Compare/Contrast the Lac and Ara operons.
asked 47 minutes ago -
Part A
What is the maximum speed with which a 1200-kg car can round a
turn...
asked 48 minutes ago -
Write in c++ please
Read and write 5 students information such as, Student
ID, first name,...
asked 47 minutes ago