
Homework Answers
External cost = $140 per ton
Social cost = Private cost + External cost
From the given graph we get the table as shown below:
| Q | Demand (Private value) | Supply (private cost) | Social cost |
| 1 | 560 | 35 | 175 |
| 2 | 490 | 105 | 245 |
| 3 | 420 | 210 | 350 |
| 4 | 350 | 280 | 420 |
| 5 | 280 | 350 | 490 |
| 6 | 245 | 420 | 560 |
By plotting this we get the social cost curve as shown below:
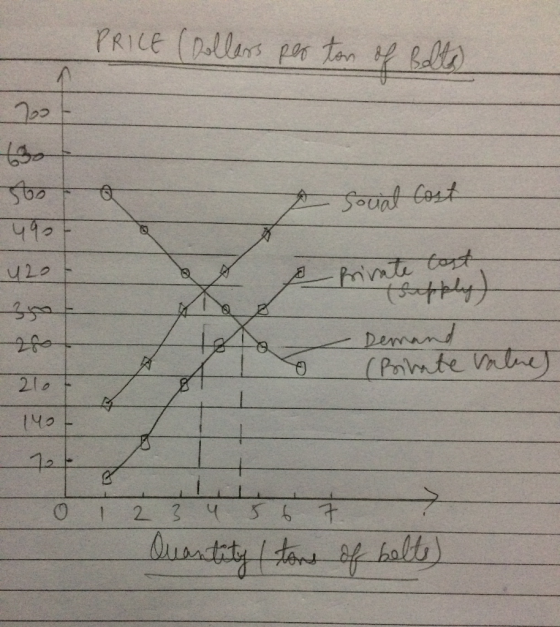
The market equilibrium quantity is 4.5 tons of bolts where demand equals supply , but the socially optimal quantity of bolt production is 3.5 tons where demand equals social cost.
To create an incentive to produce the socially optimal quantity of bolts,the government could impose a tax of $140 per ton i.e external cost.
Add Answer to:
Homework (Ch 10) 3. The effect of negative externalities on the optimal quantity of consumption Consider the market...
3. The effect of negative externalities on the optimal quantity of consumption Consider the market for...
 3. The effect of negative externalities on the optimal quantity of consumption Consider the market for bolts. Suppose that a hardware factory dumps toxic waste into a nearby river, creating a negative externality for those living downstream from the factory. Producing an additional ton of bolts imposes a constant external cost of $140 per ton. The following graph shows the demand (private value) curve and the supply (private cost) curve for bolts. Use the purple points (diamond symbol) to plot...
3. The effect of negative externalities on the optimal quantity of consumption Consider the market for...
 3. The effect of negative externalities on the optimal quantity of consumption Consider the market for bolts. Suppose that a hardware factory dumps toxic waste into a nearby river, creating a negative externality for those living downstream from the factory. Producing an additional ton of bolts imposes a constant external cost of $225 per ton. The following graph shows the demand (private value) curve and the supply (private cost) curve for bolts Use the purple points (diamond symbol) to plot...
The effect of negative externalities on the optimal quantity of consumption Consider the market for bolts. Suppose that...
 The effect of negative externalities on the optimal
quantity of consumption
Consider the market for bolts. Suppose that a hardware factory
dumps toxic waste into a nearby river, creating a negative
externality for those living downstream from the factory. Producing
an additional ton of bolts imposes a constant external cost of $40
per ton. The following graph shows the demand (private value) curve
and the supply (private cost) curve for bolts.
1. plot the social cost curve when the external...
The effect of negative externalities on the optimal
quantity of consumption
Consider the market for bolts. Suppose that a hardware factory
dumps toxic waste into a nearby river, creating a negative
externality for those living downstream from the factory. Producing
an additional ton of bolts imposes a constant external cost of $40
per ton. The following graph shows the demand (private value) curve
and the supply (private cost) curve for bolts.
1. plot the social cost curve when the external...
3. The effect of negative externalities on the optimal quantityof consumption Consider the market for bolts....
 3. The effect of negative externalities on the optimal quantityof consumption Consider the market for bolts. Suppose that a hardware factory dumps toxic waste into a nearby river, creating a negative externality for those living downstream from the factory. Producing an additional ton of bolts imposes a constant external cost of $330 per ton. The following graph shows the demand (private value) curve and the supply (private cost) curve for bolts. Use the purple points (diamond symbol) to plot the...
Homework (Ch 10) 3. The effect of negative externalities on the optimal quantity of consumption Consider...
 Homework (Ch 10) 3. The effect of negative externalities on the optimal quantity of consumption Consider the market for bolts. Suppose that a hardware factory dumps toxic waste into a nearby river, creating a negative externality for those living downstream from the factory. Producing an additional ton of bolts imposes a constant external cost of $225 per ton. The following graph shows the demand (private value) curve and the supply (private cost) curve for bolts. Use the purple points (diamond...
3. The effect of negative externalities on the optimal quantity of consumption Consider the market for...
 3. The effect of negative externalities on the optimal quantity of consumption Consider the market for paper. Suppose that a paper factory dumps toxic waste into a nearby river, creating a negative externality for those living downstream from the factory. Producing an additional ton of paper imposes a constant external cost of $150 per ton. The following graph shows the demand (private value) curve and the supply (private cost) curve for paper. Use the purple points (diamond symbol) to plot...
3. The effect of negative externalities on the optimal quantityof consumption Consider the market for paper....
 3. The effect of negative externalities on the optimal quantityof consumption Consider the market for paper. Suppose that a paper factory dumps toxic waste into a nearby river, creating a negative externality for those living downstream from the factory. Producing an additional ton of paper imposes a constant external cost of $140 per ton. The following graph shows the demand (private value) curve and the supply (private cost) curve for paper. Use the purple points (diamond symbol) to plot the...
park confer Homework (Ch 10) 2. The effect of negative externalities on the optimal quantity of...
 park confer
Homework (Ch 10) 2. The effect of negative externalities on the optimal quantity of consumption Consider the market for paper. Suppose that a paper factory dumps toxic waste into a nearby river, creating a negative externality for those living downstream from the factory Producing an additional ton of paper imposes a constant external cost of $140 per ton. The following graph shows the demand (private value) curve and the supply (private cost) curve for paper. Use the purple...
park confer
Homework (Ch 10) 2. The effect of negative externalities on the optimal quantity of consumption Consider the market for paper. Suppose that a paper factory dumps toxic waste into a nearby river, creating a negative externality for those living downstream from the factory Producing an additional ton of paper imposes a constant external cost of $140 per ton. The following graph shows the demand (private value) curve and the supply (private cost) curve for paper. Use the purple...
3. The effect of negative externalities on the optimal quantity of consumption Consider the market for...
 3. The effect of negative externalities on the optimal quantity of consumption Consider the market for steel. Suppose that a steel manufacturing plant dumps toxic waste into a nearby river, creating a negative externality for those living downstream from the plant. Producing an additional ton of steel imposes a constant external cost of $315 per ton. The following graph shows the demand (private value) curve and the supply (private cost) curve for steel. Use the purple points (diamond symbol) to...
3. The effect of negative externalities on the optimal quantity of consumption Consider the market for...
 3. The effect of negative externalities on the optimal quantity of consumption Consider the market for steel. Suppose that a steel manufacturing plant dumps toxic waste into a nearby river, creating a negative externality for those living downstream from the plant. Producing an additional ton of steel imposes a constant external cost of $385 per ton. The following graph shows the demand (private value) curve and the supply (private cost) curve for steel, Use the purple points (diamond symbol) to...
 3. The effect of negative externalities on the optimal quantity of consumption Consider the market for bolts. Suppose that a hardware factory dumps toxic waste into a nearby river, creating a negative externality for those living downstream from the factory. Producing an additional ton of bolts imposes a constant external cost of $140 per ton. The following graph shows the demand (private value) curve and the supply (private cost) curve for bolts. Use the purple points (diamond symbol) to plot...
 3. The effect of negative externalities on the optimal quantity of consumption Consider the market for bolts. Suppose that a hardware factory dumps toxic waste into a nearby river, creating a negative externality for those living downstream from the factory. Producing an additional ton of bolts imposes a constant external cost of $225 per ton. The following graph shows the demand (private value) curve and the supply (private cost) curve for bolts Use the purple points (diamond symbol) to plot...
 The effect of negative externalities on the optimal
quantity of consumption
Consider the market for bolts. Suppose that a hardware factory
dumps toxic waste into a nearby river, creating a negative
externality for those living downstream from the factory. Producing
an additional ton of bolts imposes a constant external cost of $40
per ton. The following graph shows the demand (private value) curve
and the supply (private cost) curve for bolts.
1. plot the social cost curve when the external...
The effect of negative externalities on the optimal
quantity of consumption
Consider the market for bolts. Suppose that a hardware factory
dumps toxic waste into a nearby river, creating a negative
externality for those living downstream from the factory. Producing
an additional ton of bolts imposes a constant external cost of $40
per ton. The following graph shows the demand (private value) curve
and the supply (private cost) curve for bolts.
1. plot the social cost curve when the external...
 3. The effect of negative externalities on the optimal quantityof consumption Consider the market for bolts. Suppose that a hardware factory dumps toxic waste into a nearby river, creating a negative externality for those living downstream from the factory. Producing an additional ton of bolts imposes a constant external cost of $330 per ton. The following graph shows the demand (private value) curve and the supply (private cost) curve for bolts. Use the purple points (diamond symbol) to plot the...
 Homework (Ch 10) 3. The effect of negative externalities on the optimal quantity of consumption Consider the market for bolts. Suppose that a hardware factory dumps toxic waste into a nearby river, creating a negative externality for those living downstream from the factory. Producing an additional ton of bolts imposes a constant external cost of $225 per ton. The following graph shows the demand (private value) curve and the supply (private cost) curve for bolts. Use the purple points (diamond...
 3. The effect of negative externalities on the optimal quantity of consumption Consider the market for paper. Suppose that a paper factory dumps toxic waste into a nearby river, creating a negative externality for those living downstream from the factory. Producing an additional ton of paper imposes a constant external cost of $150 per ton. The following graph shows the demand (private value) curve and the supply (private cost) curve for paper. Use the purple points (diamond symbol) to plot...
 3. The effect of negative externalities on the optimal quantityof consumption Consider the market for paper. Suppose that a paper factory dumps toxic waste into a nearby river, creating a negative externality for those living downstream from the factory. Producing an additional ton of paper imposes a constant external cost of $140 per ton. The following graph shows the demand (private value) curve and the supply (private cost) curve for paper. Use the purple points (diamond symbol) to plot the...
 park confer
Homework (Ch 10) 2. The effect of negative externalities on the optimal quantity of consumption Consider the market for paper. Suppose that a paper factory dumps toxic waste into a nearby river, creating a negative externality for those living downstream from the factory Producing an additional ton of paper imposes a constant external cost of $140 per ton. The following graph shows the demand (private value) curve and the supply (private cost) curve for paper. Use the purple...
park confer
Homework (Ch 10) 2. The effect of negative externalities on the optimal quantity of consumption Consider the market for paper. Suppose that a paper factory dumps toxic waste into a nearby river, creating a negative externality for those living downstream from the factory Producing an additional ton of paper imposes a constant external cost of $140 per ton. The following graph shows the demand (private value) curve and the supply (private cost) curve for paper. Use the purple...
 3. The effect of negative externalities on the optimal quantity of consumption Consider the market for steel. Suppose that a steel manufacturing plant dumps toxic waste into a nearby river, creating a negative externality for those living downstream from the plant. Producing an additional ton of steel imposes a constant external cost of $315 per ton. The following graph shows the demand (private value) curve and the supply (private cost) curve for steel. Use the purple points (diamond symbol) to...
 3. The effect of negative externalities on the optimal quantity of consumption Consider the market for steel. Suppose that a steel manufacturing plant dumps toxic waste into a nearby river, creating a negative externality for those living downstream from the plant. Producing an additional ton of steel imposes a constant external cost of $385 per ton. The following graph shows the demand (private value) curve and the supply (private cost) curve for steel, Use the purple points (diamond symbol) to...
Most questions answered within 3 hours.
-
You are attempting to calculate a firm’s free cash flow to
equity. You know the following...
asked 23 minutes ago -
the following reaction occurs in a balloon containing
N2O2 gas
N2O4(g)=2NO2(g)
will the volume of the...
asked 58 minutes ago -
answer the questions throughout this program
public class Day implements Comparable {
Private Boolean atWork;...
asked 1 hour ago -
This is C++ code for parking fee management program
#include <iostream>
#include <iomanip>
using namespace std;...
asked 1 hour ago -
The free energy change for the following reaction at 25 °C, when
[Sn2+] = 1.17 M...
asked 3 hours ago -
An MNE is this kind of industry when competition in one country
is essentially independent of...
asked 4 hours ago -
. For this set of questions, determine what
proportion of a normal distribution is located betweeneach...
asked 5 hours ago -
A college student is employed as a door-to-door newspaper
salesman. Historical data suggests that the student...
asked 6 hours ago -
MATLAB HW 11 problem using Switch Case and Input commands
Write a script file that calculates...
asked 5 hours ago -
Considering gravitational time dilation, calculate the time that
passes in Earth’s surface while 1 hour passes...
asked 6 hours ago -
Minitab Problem: Take the Lake Hume June rainfall data and find
use the processes outlined in...
asked 7 hours ago -
X Company is trying to decide whether to continue using old
equipment to make Product A...
asked 7 hours ago