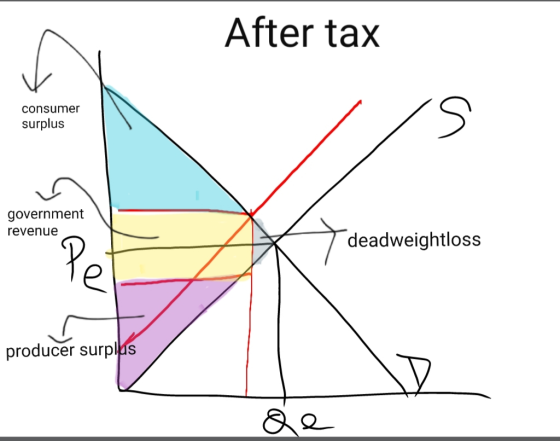
Suppose that the government of China decided to impose a per unit tax on the suppliers of salt. (a) Using a supply and d...
Suppose that the government of China decided to impose a per
unit tax on the suppliers of salt.
(a) Using a supply and demand model, show and explain the impact
that the per unit tax had on the equilibrium price and quantity of
salt. (4 marks)
(b) Using the diagram created for your answer to (a), show and
explain what effect the per unit tax had on consumer surplus,
producer surplus and deadweight loss. (6 marks)
(c) List three reasons a government may impose a tax. Discuss the
link between government revenue from taxation and elasticity of
demand. (5 marks)
Homework Answers
Ans) When government imposes tax, burden is shared by both buyers and sellers. But who will bear more burden of the tax, depends upon the elasticity of demand and supply. Consequently, the less elastic side of the market bears greater burden of the tax.
Tax reduces both consumer and producer surplus. It raises the price paid by buyers and reduces the price received by sellers. It reduces the quantity sold and raises revenue for the government. It also creates deadweightloss which means loss in market efficiency.
When demand is less elastic, tax burden falls more upon the buyers and when demand is more elastic, tax burden falls more upon the sellers. Further, when demand is more elastic, government revenue is less and deadweightloss is more. And if demand is less elastic government can raise more tax revenue with less deadweightloss.
Reasons government impose tax÷
- To raise money for day to day business.
- Firm is producing negative externality i.e polluting environment.
- Government imposes tax to discourage some activities like consumption of alcohol.


Add Answer to:
Suppose that the government of China decided to impose a per unit tax on the suppliers of salt. (a) Using a supply and d...
5. TAXES/SUBSIDIES, AND OTHER GOVERNMENT REGULATIONS 1. Consider the demand and supply for bubbly water in...
 5. TAXES/SUBSIDIES, AND OTHER GOVERNMENT REGULATIONS 1. Consider the demand and supply for bubbly water in a market represented by the following equations: QD = 15 - 10P QS = 40P - 50 where Q is millions of bottles per year and P measures dollars per bottle. The equilibrium price of bubbly water is $1.30 per bottle and 2 million bottles are sold each year. (a) Calculate the price elasticity of demand and the price elasticity of supply at the...
A low income town decides to impose a $3 per unit subsidy on the consumers of...
A low income town decides to impose a $3 per unit subsidy on the consumers of T-shirts. The supply and demand for T-shirts are described by the following equations: Supply: Q = 2P Demand: Q = 20 - 2P Q measures the quantity of T-shirts, and P measures the price per T-shirt. a. Graphically illustrate the effect of this subsidy on the T-shirt market and calculate the consumer surplus with subsidy, producer surplus with subsidy and total surplus with...
The market for rice in a country has the following demand and supply functions: Demand function: ...
The market for rice in a country has the following demand and supply functions: Demand function: P = 6 – 0.5QD Supply function: P = 2 + 0.5QS Where QD is the quantity demanded, QS is the quantity supplied and P is the unit price of rice. Determine the equilibrium price, quantity, consumer surplus and producer surplus in the rice market. Illustrate your answers with a suitable rice market diagram. (8 marks) To help the rice farmers, the government has...
wanna check final answer I already did it Taxation Suppose now the government decides to intervene the market with...
 wanna check final answer I already did it
Taxation Suppose now the government decides to intervene the market with a tax on producers of $4, determine the price for the consumer, the g. price for the producer, and the quantity produced with the tax Draw a graph (Diagram 4) representing the market for Hallowcen costurmes with a tax on producers of $4. Accurately label and show the h. area for consumers (CS), producer surplus (PS), deadweight loss (DWL), and government...
wanna check final answer I already did it
Taxation Suppose now the government decides to intervene the market with a tax on producers of $4, determine the price for the consumer, the g. price for the producer, and the quantity produced with the tax Draw a graph (Diagram 4) representing the market for Hallowcen costurmes with a tax on producers of $4. Accurately label and show the h. area for consumers (CS), producer surplus (PS), deadweight loss (DWL), and government...
a. Draw supply curve and demand curve for vitamins, with the equilibrium price at $13.00 per...
 a. Draw supply curve and demand curve for vitamins, with the equilibrium price at $13.00 per bottle, and show the consumer surplus and producer plus when the market price is at the equilibrium. b. Suppose that the government believe that this price is too high to promote good health among its citizens, and installs a price ceiling of $10.00 per bottle. Show the effect of this policy on consumer and producer surplus, and label any deadweight loss created by the...
When the government decides to impose a tax on sellers of a good or service, sellers...
When the government decides to impose a tax on sellers of a good or service, sellers try to pass the tax on to consumers by raising the price of the good being sold. Assume the government decides to place a $1 tax on each unit of a good sold, e.g., tires. Using the simple model of supply and demand, describe what would happen to the price and quantity of tires sold. Would the amount of tax paid by the consumer...
Now suppose that the government imposes a $2 tax per case on the sellers of microwave...
 Now suppose that the government imposes a $2 tax per case on the sellers of microwave popcorn. The graph below shows the effects of this tax. Supply Demand 100 200 300 400 500 600 700 800 900 Quantity Using the information in the graph above, identify each of the following (after the tax is imposed): e. the new equilibrium price and quantity f. price paid by buyers g. price received by sellers h. consumer surplus i. producer surplus j. government...
Suppose that the demand curve for wheat is Qd= 400-10p Qs= 10p The government provides producers with a specific subsidy...
Suppose that the demand curve for wheat is Qd= 400-10p Qs= 10p The government provides producers with a specific subsidy of S=$11 per unit. How do the equilibrium price and quantity change? The equilibrium price by $_______ and the equilibrium quantity by $_______ units. (Enter numeric responses using real numbers rounded to two decimal places.) What effect does this tax (subsidy) have on consumer surplus, producer surplus, government revenue, welfare, and deadweight loss? Consumer surplus (increase or decrease) by $...
Suppose the government imposes a $20-per-bottle tax on suppliers.
 Suppose the government imposes a $20-per-bottle tax on suppliers.At this tax amount, the equilibrium quantity of gin is _______ bottles, and the government collects $_______ in tax revenue.Now calculate the government's tax revenue if it sets a tax of 50, $20, $40, $50, $60, $80, or $100 per bottle. Hint: To find the equilibrium quantity after the tax, adjust the "Quantity" field until the Tax equals the value of the per-unit tax.) Using the data you generate, plot a Laffer...
The government is considering levying a tax of $60 per unit on suppliers of either concert...
 The government is considering levying a tax of $60 per unit on suppliers of either concert tickets or bus passes. The supply curve for each of these two goods is identical, as you can see on each of the following graphs. The demand for concert tickets is shown by De (on the first graph), and the demand for bus passes is shown by D. (on the second graph). Suppose the government taxes concert tickets. The following graph shows the annual...
 5. TAXES/SUBSIDIES, AND OTHER GOVERNMENT REGULATIONS 1. Consider the demand and supply for bubbly water in a market represented by the following equations: QD = 15 - 10P QS = 40P - 50 where Q is millions of bottles per year and P measures dollars per bottle. The equilibrium price of bubbly water is $1.30 per bottle and 2 million bottles are sold each year. (a) Calculate the price elasticity of demand and the price elasticity of supply at the...
 wanna check final answer I already did it
Taxation Suppose now the government decides to intervene the market with a tax on producers of $4, determine the price for the consumer, the g. price for the producer, and the quantity produced with the tax Draw a graph (Diagram 4) representing the market for Hallowcen costurmes with a tax on producers of $4. Accurately label and show the h. area for consumers (CS), producer surplus (PS), deadweight loss (DWL), and government...
wanna check final answer I already did it
Taxation Suppose now the government decides to intervene the market with a tax on producers of $4, determine the price for the consumer, the g. price for the producer, and the quantity produced with the tax Draw a graph (Diagram 4) representing the market for Hallowcen costurmes with a tax on producers of $4. Accurately label and show the h. area for consumers (CS), producer surplus (PS), deadweight loss (DWL), and government...
 a. Draw supply curve and demand curve for vitamins, with the equilibrium price at $13.00 per bottle, and show the consumer surplus and producer plus when the market price is at the equilibrium. b. Suppose that the government believe that this price is too high to promote good health among its citizens, and installs a price ceiling of $10.00 per bottle. Show the effect of this policy on consumer and producer surplus, and label any deadweight loss created by the...
 Now suppose that the government imposes a $2 tax per case on the sellers of microwave popcorn. The graph below shows the effects of this tax. Supply Demand 100 200 300 400 500 600 700 800 900 Quantity Using the information in the graph above, identify each of the following (after the tax is imposed): e. the new equilibrium price and quantity f. price paid by buyers g. price received by sellers h. consumer surplus i. producer surplus j. government...
 Suppose the government imposes a $20-per-bottle tax on suppliers.At this tax amount, the equilibrium quantity of gin is _______ bottles, and the government collects $_______ in tax revenue.Now calculate the government's tax revenue if it sets a tax of 50, $20, $40, $50, $60, $80, or $100 per bottle. Hint: To find the equilibrium quantity after the tax, adjust the "Quantity" field until the Tax equals the value of the per-unit tax.) Using the data you generate, plot a Laffer...
 The government is considering levying a tax of $60 per unit on suppliers of either concert tickets or bus passes. The supply curve for each of these two goods is identical, as you can see on each of the following graphs. The demand for concert tickets is shown by De (on the first graph), and the demand for bus passes is shown by D. (on the second graph). Suppose the government taxes concert tickets. The following graph shows the annual...
Most questions answered within 3 hours.
-
Consider the competitive environment of Starbuck's, Progressive
Insurance, a manufacturing firm with low turnover, or a...
asked 33 minutes ago -
3. Gains from trade
Consider two neighbouring island countries called Euphoria and
Contente. They each have...
asked 2 hours ago -
A business executive has the option to invest money in two
plans: Plan A guarantees that...
asked 4 hours ago -
Hello, can someone please help me answer this question?
How much heat is absorbed by a...
asked 4 hours ago -
. A marketing researcher conducted a survey of 25 shoppers
randomly selected at the local mall...
asked 5 hours ago -
Create an comprehensive response to the
following:
Antimicrobial agents work on a multitude of microbes (bacteria,...
asked 5 hours ago -
6.13 LAB: Step counter. Section 6.3.
A pedometer treats walking 2,000 steps as walking 1 mile....
asked 4 hours ago -
(14.2) A block of mass m = 10 kg riding on a frictionless
horizontal plane is...
asked 5 hours ago -
Use any search engine to search for articles about Starbucks
partnership with Tata Companies in India...
asked 5 hours ago -
Let’s say that for some reason Bank Excess Reserves suddenly
increase sharply. What effect would this...
asked 5 hours ago -
Given:
Curent Assets: $600,000
Total Assets: $2,600,000
Current Liabilities: $500,000
Total Liabilities: $1,700,000
What is the...
asked 5 hours ago -
1. What is a “Bankster”? What is insider trading? Why is it
illegal?
2. What is...
asked 5 hours ago