
Homework Answers
We have:

Now, consider R2:
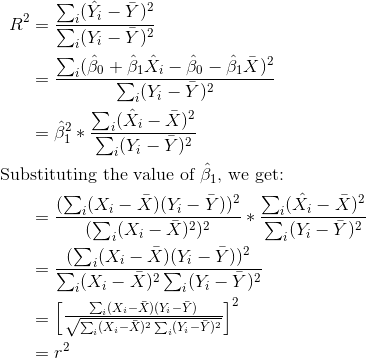
Hence Proved.
For any queries, feel free to comment and ask.
If the solution was helpful to you, don't forget to upvote it by clicking on the 'thumbs up' button.
Add Answer to:
This represents the proportion of the variability on the distribution of Y that can be explained for by the mode (15 po...
The proportion of the variation in the dependent variable y that is explained by the estimated...
The proportion of the variation in the dependent variable y that is explained by the estimated regression equation is measured by the _____. a. correlation coefficient b. coefficient of determination c. confidence interval estimate d. standard error of t
A sales manager collected the following data on x = years of experience and y =...
A sales manager collected the following data on x = years of experience and y = annual sales ($1,000s). The estimated regression equation for these data is ŷ = 80 + 4x. Salesperson Years of Experience Annual Sales ($1,000s) 1 1 80 2 3 97 3 4 97 4 4 102 5 6 103 6 8 101 7 10 119 8 10 118 9 11 127 10 13 136 (a) Compute SST, SSR, and SSE. SST= SSR= SSE= (b) Compute...
The following data show the brand, price ($), and the overall score for six stereo headphones...
The following data show the brand, price ($), and the overall score for six stereo headphones that were tested by a certain magazine. The overall score is based on sound quality and effectiveness of ambient noise reduction. Scores range from 0 (lowest) to 100 (highest). The estimated regression equation for these data is ŷ = 20.455 + 0.335x, where x = price ($) and y = overall score. Brand Price ($) Score A 180 78 B 150 69 C 95...
The following data show the brand, price ($), and the overall score for six stereo headphones...
The following data show the brand, price ($), and the overall score for six stereo headphones that were tested by a certain magazine. The overall score is based on sound quality and effectiveness of ambient noise reduction. Scores range from 0 (lowest) to 100 (highest). The estimated regression equation for these data is ŷ = 23.064 + 0.309x, where x = price ($) and y = overall score. Brand Price ($) Score A 180 74 B 150 69 C 95...
please help with the attachment X 12 6/2014 55 35 45 10 15 The estimated regression...
 please help with the attachment
X 12 6/2014 55 35 45 10 15 The estimated regression equation for these data is 9 - 62.25 -2.75x (a) Compute SSE, SST, and SSR using equations SSE 1-9), SST - DIY, -77%, and SSR-319,-7). SSE - SST - SSR- (b) Compute the coefficient of determination (Round your answer to three decimal places.) Comment on the goodness of fit. (For purposes of this exercise, consider a proportion large if it is at least 0.55.)...
please help with the attachment
X 12 6/2014 55 35 45 10 15 The estimated regression equation for these data is 9 - 62.25 -2.75x (a) Compute SSE, SST, and SSR using equations SSE 1-9), SST - DIY, -77%, and SSR-319,-7). SSE - SST - SSR- (b) Compute the coefficient of determination (Round your answer to three decimal places.) Comment on the goodness of fit. (For purposes of this exercise, consider a proportion large if it is at least 0.55.)...
please help me with b x 3 12 6 20 14 Y55 35 45 10 15...
 please help me with b
x 3 12 6 20 14 Y55 35 45 10 15 The estimated regression equation for these data is - 62.25 -2.75x. (a) Compute SSE, SST, and SSR using equations SSE - ELY,-9.), SST = Ely-7), and SSR-369,-7) SSE - 18.75 SST = 1490 SSR - 0361.25 Compute the coefficient of determination (Round your answer to three decimal places.) 2-10.919 Comment on the goodness of fit. (For purposes of this exercise, consider a proportion large...
please help me with b
x 3 12 6 20 14 Y55 35 45 10 15 The estimated regression equation for these data is - 62.25 -2.75x. (a) Compute SSE, SST, and SSR using equations SSE - ELY,-9.), SST = Ely-7), and SSR-369,-7) SSE - 18.75 SST = 1490 SSR - 0361.25 Compute the coefficient of determination (Round your answer to three decimal places.) 2-10.919 Comment on the goodness of fit. (For purposes of this exercise, consider a proportion large...
According to a study, the proportion of people who are satisfied with the way things are...
 According to a study, the proportion of people who are satisfied with the way things are going in their lives is 0.82. Suppose that a random sample of 100 people is obtained. Complete parts (a) through (e) below. Click here to view the standard normal distribution table (page 1). Click here to view the standard normal distribution table (page 2). O A. The response is quantitative because the responses can be measured numerically and the values added or subtracted, providing...
According to a study conducted by a statistical organization, the proportion of people who are satisfied...
 According to a study conducted by a statistical organization, the proportion of people who are satisfied with the way things are going in their lives is 0.80. Suppose that a random sample of 100 people is obtained Complete parts (a) through e) below (a) Suppose the random sample of 100 people is asked, "Are you satisfied with the way things are going in your life" is the response to this question qualitative or quantitative? Explain O A The response is...
A sales manager collected the following data on x = years of experience and y =...
 A sales manager collected the following data on x = years of experience and y = annual sales ($1,000s). The estimated regression equation for these data is ý = 81 + 4x. Salesperson Years of Experience Annual Sales ($1,000s) 1 107 103 101 119 8 9 10 10 11 13 123 127 136 (a) Compute SST, SSR, and SSE. SST = SSR = SSE = (b) Compute the coefficient of determination 2. (Round your answer to three decimal places.) 12...
Given are five observations for two variables, x and y. xi 4 8 14 16 18...
Given are five observations for two variables, x and y. xi 4 8 14 16 18 yi 58 52 45 24 11 The estimated regression equation for these data is y= 75.06 - 3.09x. A. Compute SSE, SST, and SSR using the following equations (to 2 decimal). B.Compute the coefficient of determination r2 (to 3 decimals). The least squares line provided an (good/bad) fit; ---------% of the variability in y has been explained by the estimated regression equation (to 1...
 please help with the attachment
X 12 6/2014 55 35 45 10 15 The estimated regression equation for these data is 9 - 62.25 -2.75x (a) Compute SSE, SST, and SSR using equations SSE 1-9), SST - DIY, -77%, and SSR-319,-7). SSE - SST - SSR- (b) Compute the coefficient of determination (Round your answer to three decimal places.) Comment on the goodness of fit. (For purposes of this exercise, consider a proportion large if it is at least 0.55.)...
please help with the attachment
X 12 6/2014 55 35 45 10 15 The estimated regression equation for these data is 9 - 62.25 -2.75x (a) Compute SSE, SST, and SSR using equations SSE 1-9), SST - DIY, -77%, and SSR-319,-7). SSE - SST - SSR- (b) Compute the coefficient of determination (Round your answer to three decimal places.) Comment on the goodness of fit. (For purposes of this exercise, consider a proportion large if it is at least 0.55.)...
 please help me with b
x 3 12 6 20 14 Y55 35 45 10 15 The estimated regression equation for these data is - 62.25 -2.75x. (a) Compute SSE, SST, and SSR using equations SSE - ELY,-9.), SST = Ely-7), and SSR-369,-7) SSE - 18.75 SST = 1490 SSR - 0361.25 Compute the coefficient of determination (Round your answer to three decimal places.) 2-10.919 Comment on the goodness of fit. (For purposes of this exercise, consider a proportion large...
please help me with b
x 3 12 6 20 14 Y55 35 45 10 15 The estimated regression equation for these data is - 62.25 -2.75x. (a) Compute SSE, SST, and SSR using equations SSE - ELY,-9.), SST = Ely-7), and SSR-369,-7) SSE - 18.75 SST = 1490 SSR - 0361.25 Compute the coefficient of determination (Round your answer to three decimal places.) 2-10.919 Comment on the goodness of fit. (For purposes of this exercise, consider a proportion large...
 According to a study, the proportion of people who are satisfied with the way things are going in their lives is 0.82. Suppose that a random sample of 100 people is obtained. Complete parts (a) through (e) below. Click here to view the standard normal distribution table (page 1). Click here to view the standard normal distribution table (page 2). O A. The response is quantitative because the responses can be measured numerically and the values added or subtracted, providing...
 According to a study conducted by a statistical organization, the proportion of people who are satisfied with the way things are going in their lives is 0.80. Suppose that a random sample of 100 people is obtained Complete parts (a) through e) below (a) Suppose the random sample of 100 people is asked, "Are you satisfied with the way things are going in your life" is the response to this question qualitative or quantitative? Explain O A The response is...
 A sales manager collected the following data on x = years of experience and y = annual sales ($1,000s). The estimated regression equation for these data is ý = 81 + 4x. Salesperson Years of Experience Annual Sales ($1,000s) 1 107 103 101 119 8 9 10 10 11 13 123 127 136 (a) Compute SST, SSR, and SSE. SST = SSR = SSE = (b) Compute the coefficient of determination 2. (Round your answer to three decimal places.) 12...
Most questions answered within 3 hours.
-
At a local university, you poll a group of 115 students and find
that 37 of...
asked 2 minutes ago -
Gladstone company tracks the number of units purchased and sold
throughout each accounting period but applies...
asked 5 minutes ago -
When determining if a molecule's configuration is E or Z, what
determines the higher priority groups?
asked 9 minutes ago -
13. What is the amount
of conversion cost transferred to finished goods? (Round
your intermediate calculations...
asked 11 minutes ago -
Sulfuric Acid is a "strong" acid, but only releases a single
proton when it dissolves. What...
asked 10 minutes ago -
The
second floor of a house is 6 m above the street level. How much
work...
asked 13 minutes ago -
What uncontrollable factor(s) contributed to Hong Kong Disney’s
poor performance during its first year?
asked 14 minutes ago -
I wish to estimate µ, the mean of a population. After I collect
and an-
alyze...
asked 21 minutes ago -
You are interested in whether students that have a male
instructors perform differently on exams. To...
asked 27 minutes ago -
Discuss the following: The policies that promote economic
growth. Why are some countries more developed than...
asked 22 minutes ago -
I am supposed to reduce redundancy in the code and also make
unknown inputs, output "unknown"....
asked 28 minutes ago -
The ages of a group of
147
randomly selected adult females have a standard deviation of...
asked 32 minutes ago