Compaction test

mass of wet sample 106.49 98.45 105.37 111.2996.27 and container mass of dry sample 97.5589.42 96.88 101.54 88.02 and container Mass of container 22.97 23.3423.4423.32 25.84 mass of 8.94 9.03 9.75 8.49 water (g) mass of dry 4.5866.0873.44 78.22 62.18 sample water content 11.98713 13.66525 11.56046 12.46484 13.26793 dry density 0.079004 (g/cmA3 0.07 0.077797 0.08286 0.065869 container 944 cm3 volume
Homework Answers


Add Answer to:
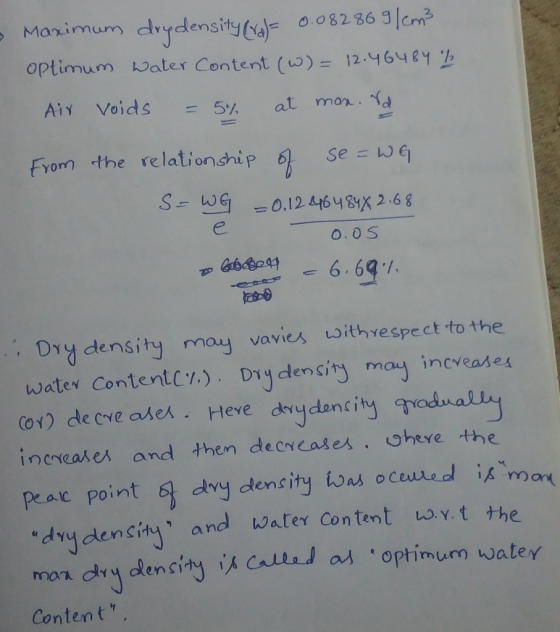
Compaction test Determine the degree of saturation and the air voids at maximum dry density. Discuss the reasons for t...
For the data in Fig. 5.1: (a) Estimate the maximum dry density and optimum water content...
 For the data in Fig. 5.1: (a) Estimate the maximum dry density and optimum water content for both the standard curve and the modified Proctor curve. (b) What is the placement water content range for 90% relative compaction for the modified Proctor curve and 95% relative compaction for the standard Proctor curve? (c) For both curves, estimate the maximum placement water content for the minimum compactive effort to achieve the percent relative compaction in part (b) Reference: Figure 5.1 2.0...
Compaction 1. Why do we compact soils to 90 or 95% Standard Proctor (.e. maximum dry...
 Compaction 1. Why do we compact soils to 90 or 95% Standard Proctor (.e. maximum dry unit weight) instead of 100% Standard Proctor? 2. At what saturation is the theoretical minimum void ratio achieved? 3. The following data were determined from a compaction test for a soil with a specific gravity of solids = 2.65 Water content Total Unit Weight (lb/ft) 10 98 106 119 125 128 124 119 (%) Graph the compaction curve (dry unit weight versus water content),...
3. Modified Proctor compaction test results for a soil at a construction site indicated that the...
 3. Modified Proctor compaction test results for a soil at a construction site indicated that the maximum dry density Ya = 120 lb/A’ at an optimum water content wopt = 9.0%. Assuming specific gravity of the mineral solids Ga=2.67, calculate: (a) the void ratio at the maximum dry density (b) the degree of saturation S at maximum dry density.
3. Modified Proctor compaction test results for a soil at a construction site indicated that the...
 3. Modified Proctor compaction test results for a soil at a construction site indicated that the maximum dry density ya = 125 lb/ft at an optimum water content Wopt = 9.5%. Assuming specific gravity of the mineral solids G=2.65, calculate: (a) the void ratio at the maximum dry density (b) the degree of saturation Sat maximum dry density.
standard Proctor compaction test conducted on a clay sample gave the following results Weight of wet soil in the mould...
 standard Proctor compaction test conducted on a clay sample gave the following results Weight of wet soil in the mould (g) | 1765 1860 1924 1947 1928 1906 Moisture content (%) 13.1 14.9 16.8 18.9 21.1 23.2 If the volume of the sample mould is 944 cm3, Determine the maximum dry density and optimum moisture content of the clay Draw on the same graph 5% voids ratio line. Sketch the dry density-moisture content curve you expect from modified Proctor compaction...
The following results were obtained from standard Proctor compaction tests. Test ID Mass of moist soil...
 The following results were obtained from standard Proctor compaction tests. Test ID Mass of moist soil (kg) 1 1.633 Standard Proctor Test 2 . 1.841 1.907 1.822 1.756 Moisture Content Test 14 14 Mass of tin empty (g) Mass of tin + wet sample (g) Mass of tin + dry sample (g) 98 62 878280 (a) Calculate moisture content (w) and dry unit weight (ya) for standard Proctor compaction tests. Plot moisture content (w) vs. dry unit weight (yd). Given:...
Two compaction tests, a standard Proctor test and a modified Proctor test, were performed on a...
 Two compaction tests, a standard Proctor test and a modified Proctor test, were performed on a particular soil. Label which curve corresponds to which test. Label the maximum dry density and optimum water content for the higher curve. Derive an expression for the Zero Air Voids (ZAV) line shown in the figure below. The form of the line should be ya - f(w,Gs) ZAV (S-100%) Yd
volume of container is 944 cm^3 The top three row was recorded from a practical and the remaining was calculated by mys...
 volume of container is 944 cm^3
The top three row was recorded from a practical and the
remaining was calculated by myself.
please 1) Plot the lines of zero, 5% and 10% air voids or 100%,
95% and 90% degrees of saturation curves on the same graph of dry
density versus water content.
2) Determine the maximum dry density and the optimum water
content.
mass of wet sample 61 62 54 61 & container mass of dry sample 54.454.91 48.48...
volume of container is 944 cm^3
The top three row was recorded from a practical and the
remaining was calculated by myself.
please 1) Plot the lines of zero, 5% and 10% air voids or 100%,
95% and 90% degrees of saturation curves on the same graph of dry
density versus water content.
2) Determine the maximum dry density and the optimum water
content.
mass of wet sample 61 62 54 61 & container mass of dry sample 54.454.91 48.48...
The following data were obtained from a Proctor test: 12 13 19 Water content (%) Weight...
 The following data were obtained from a Proctor test: 12 13 19 Water content (%) Weight of wet sample (N) 14 18.7 16 19.3 17 18 18.9 The volume of the mold was 9.44 x 10⁻⁴m3. (a) Determine the optimum water content and maximum dry unit weight. (b) Plot the zero air voids line. (c) Determine the degree of saturation at the maximum dry unit weight.
Problem 1 (3 points) The results of a standard Proctor test are given in the following...
 Problem 1 (3 points) The results of a standard Proctor test are given in the following table. Moisture Mass of moist soil in the mold (R) Trial no. 1668 1723 1800 1850 1873 8.9 12 1868 a. Determine the maximum dry unit weight of compaction and the opti- mum moisture content. Given: Mold volume = 943.3 cm'. b. Determine the void ratio and the degree of saturation at the optimum moisture content. Given: G, = 2.73 Problem 2 (4 points)...
 For the data in Fig. 5.1: (a) Estimate the maximum dry density and optimum water content for both the standard curve and the modified Proctor curve. (b) What is the placement water content range for 90% relative compaction for the modified Proctor curve and 95% relative compaction for the standard Proctor curve? (c) For both curves, estimate the maximum placement water content for the minimum compactive effort to achieve the percent relative compaction in part (b) Reference: Figure 5.1 2.0...
 Compaction 1. Why do we compact soils to 90 or 95% Standard Proctor (.e. maximum dry unit weight) instead of 100% Standard Proctor? 2. At what saturation is the theoretical minimum void ratio achieved? 3. The following data were determined from a compaction test for a soil with a specific gravity of solids = 2.65 Water content Total Unit Weight (lb/ft) 10 98 106 119 125 128 124 119 (%) Graph the compaction curve (dry unit weight versus water content),...
 3. Modified Proctor compaction test results for a soil at a construction site indicated that the maximum dry density Ya = 120 lb/A’ at an optimum water content wopt = 9.0%. Assuming specific gravity of the mineral solids Ga=2.67, calculate: (a) the void ratio at the maximum dry density (b) the degree of saturation S at maximum dry density.
 3. Modified Proctor compaction test results for a soil at a construction site indicated that the maximum dry density ya = 125 lb/ft at an optimum water content Wopt = 9.5%. Assuming specific gravity of the mineral solids G=2.65, calculate: (a) the void ratio at the maximum dry density (b) the degree of saturation Sat maximum dry density.
 standard Proctor compaction test conducted on a clay sample gave the following results Weight of wet soil in the mould (g) | 1765 1860 1924 1947 1928 1906 Moisture content (%) 13.1 14.9 16.8 18.9 21.1 23.2 If the volume of the sample mould is 944 cm3, Determine the maximum dry density and optimum moisture content of the clay Draw on the same graph 5% voids ratio line. Sketch the dry density-moisture content curve you expect from modified Proctor compaction...
 The following results were obtained from standard Proctor compaction tests. Test ID Mass of moist soil (kg) 1 1.633 Standard Proctor Test 2 . 1.841 1.907 1.822 1.756 Moisture Content Test 14 14 Mass of tin empty (g) Mass of tin + wet sample (g) Mass of tin + dry sample (g) 98 62 878280 (a) Calculate moisture content (w) and dry unit weight (ya) for standard Proctor compaction tests. Plot moisture content (w) vs. dry unit weight (yd). Given:...
 Two compaction tests, a standard Proctor test and a modified Proctor test, were performed on a particular soil. Label which curve corresponds to which test. Label the maximum dry density and optimum water content for the higher curve. Derive an expression for the Zero Air Voids (ZAV) line shown in the figure below. The form of the line should be ya - f(w,Gs) ZAV (S-100%) Yd
 volume of container is 944 cm^3
The top three row was recorded from a practical and the
remaining was calculated by myself.
please 1) Plot the lines of zero, 5% and 10% air voids or 100%,
95% and 90% degrees of saturation curves on the same graph of dry
density versus water content.
2) Determine the maximum dry density and the optimum water
content.
mass of wet sample 61 62 54 61 & container mass of dry sample 54.454.91 48.48...
volume of container is 944 cm^3
The top three row was recorded from a practical and the
remaining was calculated by myself.
please 1) Plot the lines of zero, 5% and 10% air voids or 100%,
95% and 90% degrees of saturation curves on the same graph of dry
density versus water content.
2) Determine the maximum dry density and the optimum water
content.
mass of wet sample 61 62 54 61 & container mass of dry sample 54.454.91 48.48...
 The following data were obtained from a Proctor test: 12 13 19 Water content (%) Weight of wet sample (N) 14 18.7 16 19.3 17 18 18.9 The volume of the mold was 9.44 x 10⁻⁴m3. (a) Determine the optimum water content and maximum dry unit weight. (b) Plot the zero air voids line. (c) Determine the degree of saturation at the maximum dry unit weight.
 Problem 1 (3 points) The results of a standard Proctor test are given in the following table. Moisture Mass of moist soil in the mold (R) Trial no. 1668 1723 1800 1850 1873 8.9 12 1868 a. Determine the maximum dry unit weight of compaction and the opti- mum moisture content. Given: Mold volume = 943.3 cm'. b. Determine the void ratio and the degree of saturation at the optimum moisture content. Given: G, = 2.73 Problem 2 (4 points)...
Most questions answered within 3 hours.
-
The average length of time between arrivals at a turnpike
toll-booth is 26 seconds. What is...
asked 21 minutes ago -
(a) A piston at 6.1 atm contains a gas that occupies a volume of
3.5 L....
asked 1 hour ago -
Please answer true or false. Words
cannot be changed or added in to make it true...
asked 1 hour ago -
An empty test tube weighs 15.923 grams. Then,
MgCl2•6H2O is added into the test tube. After...
asked 1 hour ago -
Assume memory access is 10 units of time and disk access is
10000 units of time....
asked 1 hour ago -
1. Are all good samples random?
2. Magazines often report surveys giving statistics such as “63%...
asked 2 hours ago -
Under all the various types of market structures, firms
must eventually earn some economic profits for...
asked 2 hours ago -
Consider the following fitness regime for a single locus trait
with two co-dominant alleles: w11 =...
asked 2 hours ago -
A large cable company reports the following.
80% of its customers subscribe to its cable TV...
asked 2 hours ago -
Please answer the question in brief.
Discuss the role of ERP in organizations. Are ERP tools...
asked 2 hours ago -
Discuss the pros and cons of collaborative software such
as SameTime. Does it increase productivity? What...
asked 2 hours ago -
Buying your in-laws a gift because it’s expected is
due to the ____________ motive of gift-giving....
asked 2 hours ago