
Homework Answers
Add Answer to:
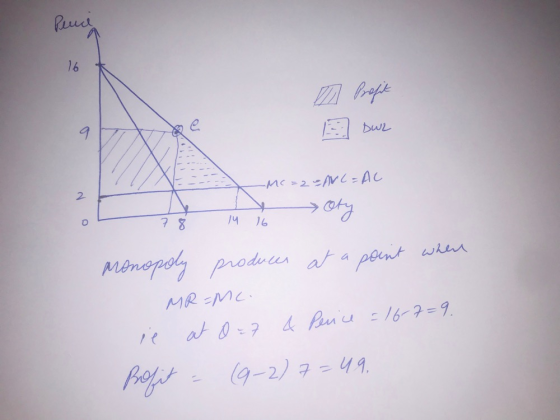
Amonopoly has a constant marginal cost of production of $2 per unit and no foed costs In the figure to the right, l...
A monopoly has a constant marginal cost of production of $2 per unit and no fixed...
 A monopoly has a constant marginal cost of production of $2 per unit and no fixed costs. In the figure to the right, let D be demand and MR be marginal revenue. TTT 1.) Using the line drawing tool, graph the monopoly's marginal cost curve. Label this curve 'MC.' 2.) Using the line drawing tool, graph the monopoly's average variable cost curve. Label this curve 'AVC.' p, $ per unit 3.) Using the line drawing tool, graph the monopoly's average...
A monopoly has a constant marginal cost of production of $4 per unit and no fixed...
 A monopoly has a constant marginal cost of production of $4 per unit and no fixed costs. In the figure to the right, let D be demand and MR be marginal revenue. 1.) Using the line drawing tool graph the monopoly's marginal cost curve. Label this curve 'MC! 2.) Using the line drawing tool, graph the monopoly's average variable cost curve. Label this curve 'AVC.' 3.) Using the line drawing tool, graph the monopoly's average cost curve. Label this curve...
Suppose a firm is a monopoly. Its marginal cost curve is flat, and its average cost...
 Suppose a firm is a monopoly. Its marginal cost curve is flat,
and its average cost curve is downward sloping (because it has a
fixed cost).
1.) Using the point drawing
tool,
indicate the monopoly's profit-maximizing price and quantity in
the figure if it cannot price discriminate. Label this point
'e 1e1.'
2.) Using the rectangle drawing
tool,
indicate the monopoly's losses at the no price discrimination
profit-maximizing price and quantity. Label this rectangle
'Losses 1Losses1.'
3.) Using the point...
Suppose a firm is a monopoly. Its marginal cost curve is flat,
and its average cost curve is downward sloping (because it has a
fixed cost).
1.) Using the point drawing
tool,
indicate the monopoly's profit-maximizing price and quantity in
the figure if it cannot price discriminate. Label this point
'e 1e1.'
2.) Using the rectangle drawing
tool,
indicate the monopoly's losses at the no price discrimination
profit-maximizing price and quantity. Label this rectangle
'Losses 1Losses1.'
3.) Using the point...
Price/Cost ($) 7) Monopoly II (6 points) The marginal costs (MC), average variable costs (AVC), and...
 Price/Cost ($) 7) Monopoly II (6 points) The marginal costs (MC), average variable costs (AVC), and average total costs (ATC) for a monopoly are shown in the figure below. The figure also shows the demand curve (D) and the marginal revenue curve (MR) for this market. 501 ATC AVC a. What is the firm's profit-maximizing level of output? Label this on the graph. b. What price will the monopolist charge for that level of output? Label this on the graph....
Score: 0 of 6 pts 5 of 10 (8 complete)> Hw Score: 36%, 21.6 of 60...
 Score: 0 of 6 pts 5 of 10 (8 complete)> Hw Score: 36%, 21.6 of 60 Text Question 2.6 Question Help Suppose a firm is a monopoly. Its marginal cost curve is flat, and its average cost curve is downward sloping (because it has a fixed cost). 1.) Using the point drawing tool, indicate the monopoly's profit-maximizing price and quantity in the figure if it cannot price discriminate. Label this point'e 2.) Using the rectangle drawing tooi, indicate the monopoly's...
A monopoly faces the demand curve P= 11 -0.5Q, where P is measured in dollars per...
 A monopoly faces the demand curve P= 11 -0.5Q, where P is measured in dollars per unit and Q in thousands of units. The monopolist has a constant average cost of $6.00 per unit. Draw the average and marginal revenue curves and the average and marginal cost curves. 1.) Using the line drawing tool, draw the average revenue curve and label it 'AR'. $/Q 2.) Using the line drawing tool, draw the marginal revenue curve and label it 'MR'. 3.)...
A monopoly faces the demand curve P = 12 - 1.0Q,
 A monopoly faces the demand curve P = 12 - 1.0Q, where P is measured in dollars per unit and Q in thousands of units. The monopolist has a constant average cost of $4.00 per unit. Draw the average and marginal revenue curves and the average and marginal cost curves. 1.) Using the line drawing tool, draw the average revenue curve and label it 'AR'. 2.) Using the line drawing tool, draw the marginal revenue curve and label it 'MR'. 3.) Using the line drawing tool,...
In some cities, Uber has a monopoly on ride-sharing services. In one town, the demand curve...
 In some cities, Uber has a monopoly on ride-sharing services. In one town, the demand curve on weekdays is given by the following equation: P = 50 - 1Q. However, during weekend nights, or surge hours, the demand for rides increases dramatically and the new demand curve is: P = 100 - 1Q. Assume that marginal cost is initially 0. What is the profit maximizing price during weekdays and surge hours? (Round answers to 2 decimal places as needed.) The...
The marginal costs (MC), average variable costs (AVC), and average total costs (ATC) for a monopoly...
 The marginal costs (MC), average variable costs (AVC), and average total costs (ATC) for a monopoly are shown in the figure below. The figure also shows the demand curve (D) and the marginal revenue curve (MR) for this market. Instructions: Use the tools provided to plot the profit-maximizing quantity (Q), the profit-maximizing price (P), the profit (Profit), and the deadweight loss (DWL). Note that the deadweight loss will be only approximate due to the curvature of the marginal cost curve....
suppose a firm's total cost of production (TC) is tc=2Q^2 mc=4Q Suppose a firm's total cost...
 suppose a firm's total cost of production (TC) is tc=2Q^2
mc=4Q
Suppose a firm's total cost of production (TC) is TC = 20 MC = 40 What do the firm's average total cost curve, average variable cost curve, and marginal cost curve look like? Draw the following curves from 0 to 5 units of output. 1.) Using the line drawing tool.graph the firm's average total cost curve and label it ATC 2.) Using the line drawing tool, graph the firm's...
suppose a firm's total cost of production (TC) is tc=2Q^2
mc=4Q
Suppose a firm's total cost of production (TC) is TC = 20 MC = 40 What do the firm's average total cost curve, average variable cost curve, and marginal cost curve look like? Draw the following curves from 0 to 5 units of output. 1.) Using the line drawing tool.graph the firm's average total cost curve and label it ATC 2.) Using the line drawing tool, graph the firm's...
 A monopoly has a constant marginal cost of production of $2 per unit and no fixed costs. In the figure to the right, let D be demand and MR be marginal revenue. TTT 1.) Using the line drawing tool, graph the monopoly's marginal cost curve. Label this curve 'MC.' 2.) Using the line drawing tool, graph the monopoly's average variable cost curve. Label this curve 'AVC.' p, $ per unit 3.) Using the line drawing tool, graph the monopoly's average...
 A monopoly has a constant marginal cost of production of $4 per unit and no fixed costs. In the figure to the right, let D be demand and MR be marginal revenue. 1.) Using the line drawing tool graph the monopoly's marginal cost curve. Label this curve 'MC! 2.) Using the line drawing tool, graph the monopoly's average variable cost curve. Label this curve 'AVC.' 3.) Using the line drawing tool, graph the monopoly's average cost curve. Label this curve...
 Suppose a firm is a monopoly. Its marginal cost curve is flat,
and its average cost curve is downward sloping (because it has a
fixed cost).
1.) Using the point drawing
tool,
indicate the monopoly's profit-maximizing price and quantity in
the figure if it cannot price discriminate. Label this point
'e 1e1.'
2.) Using the rectangle drawing
tool,
indicate the monopoly's losses at the no price discrimination
profit-maximizing price and quantity. Label this rectangle
'Losses 1Losses1.'
3.) Using the point...
Suppose a firm is a monopoly. Its marginal cost curve is flat,
and its average cost curve is downward sloping (because it has a
fixed cost).
1.) Using the point drawing
tool,
indicate the monopoly's profit-maximizing price and quantity in
the figure if it cannot price discriminate. Label this point
'e 1e1.'
2.) Using the rectangle drawing
tool,
indicate the monopoly's losses at the no price discrimination
profit-maximizing price and quantity. Label this rectangle
'Losses 1Losses1.'
3.) Using the point...
 Price/Cost ($) 7) Monopoly II (6 points) The marginal costs (MC), average variable costs (AVC), and average total costs (ATC) for a monopoly are shown in the figure below. The figure also shows the demand curve (D) and the marginal revenue curve (MR) for this market. 501 ATC AVC a. What is the firm's profit-maximizing level of output? Label this on the graph. b. What price will the monopolist charge for that level of output? Label this on the graph....
 Score: 0 of 6 pts 5 of 10 (8 complete)> Hw Score: 36%, 21.6 of 60 Text Question 2.6 Question Help Suppose a firm is a monopoly. Its marginal cost curve is flat, and its average cost curve is downward sloping (because it has a fixed cost). 1.) Using the point drawing tool, indicate the monopoly's profit-maximizing price and quantity in the figure if it cannot price discriminate. Label this point'e 2.) Using the rectangle drawing tooi, indicate the monopoly's...
 A monopoly faces the demand curve P= 11 -0.5Q, where P is measured in dollars per unit and Q in thousands of units. The monopolist has a constant average cost of $6.00 per unit. Draw the average and marginal revenue curves and the average and marginal cost curves. 1.) Using the line drawing tool, draw the average revenue curve and label it 'AR'. $/Q 2.) Using the line drawing tool, draw the marginal revenue curve and label it 'MR'. 3.)...
 In some cities, Uber has a monopoly on ride-sharing services. In one town, the demand curve on weekdays is given by the following equation: P = 50 - 1Q. However, during weekend nights, or surge hours, the demand for rides increases dramatically and the new demand curve is: P = 100 - 1Q. Assume that marginal cost is initially 0. What is the profit maximizing price during weekdays and surge hours? (Round answers to 2 decimal places as needed.) The...
 The marginal costs (MC), average variable costs (AVC), and average total costs (ATC) for a monopoly are shown in the figure below. The figure also shows the demand curve (D) and the marginal revenue curve (MR) for this market. Instructions: Use the tools provided to plot the profit-maximizing quantity (Q), the profit-maximizing price (P), the profit (Profit), and the deadweight loss (DWL). Note that the deadweight loss will be only approximate due to the curvature of the marginal cost curve....
 suppose a firm's total cost of production (TC) is tc=2Q^2
mc=4Q
Suppose a firm's total cost of production (TC) is TC = 20 MC = 40 What do the firm's average total cost curve, average variable cost curve, and marginal cost curve look like? Draw the following curves from 0 to 5 units of output. 1.) Using the line drawing tool.graph the firm's average total cost curve and label it ATC 2.) Using the line drawing tool, graph the firm's...
suppose a firm's total cost of production (TC) is tc=2Q^2
mc=4Q
Suppose a firm's total cost of production (TC) is TC = 20 MC = 40 What do the firm's average total cost curve, average variable cost curve, and marginal cost curve look like? Draw the following curves from 0 to 5 units of output. 1.) Using the line drawing tool.graph the firm's average total cost curve and label it ATC 2.) Using the line drawing tool, graph the firm's...
Most questions answered within 3 hours.
-
Please help me with this problem below
What is wrong with the following code?
if income...
asked 5 minutes ago -
The following information for the past year is available from
Thinnews Co., a company that uses...
asked 8 minutes ago -
Suppose you work for Allstate, and insurance company and the
data shows the following for auto...
asked 8 minutes ago -
The fresh fruit market and frozen dinner market are
currently in equilibrium. Fresh fruit is a...
asked 14 minutes ago -
(1 point) Golf-course designers have become concerned that old
courses are becoming obsolete since new technology...
asked 12 minutes ago -
The active retelling of dominant cultural stories is known
preserves which concept?
hegemony
heterodoxy
doxa
myth
asked 15 minutes ago -
1. Which of the following statements is true of money?
It is anything accepted in exchange...
asked 16 minutes ago -
BASED ON THE AIRBNB, ETSY, UBER: GROWING FROM ONE THOUSAND TO
ONE MILLION CUSTOMERS HARVARD CASE:...
asked 42 minutes ago -
Which of these methods cause sterilization?
Autoclaving
Dry heat
Gamma irradiation
Ethylene oxide
A.
Yes
No...
asked 47 minutes ago -
A biologist wishes to estimate the effect of an antibiotic on
the growth of a particular...
asked 55 minutes ago -
O’Deesha Company has the following information available:
Quality engineering of
products
$20,000
Quality training of
employees &n
asked 1 hour ago -
a) Draw two water molecules.
b) Clearly name and label the type of bond that exists...
asked 2 hours ago