The data in the table below represents the number of nonconformities per 1000 meters in telephone cable. Using R language to analyze the data and determine: Is process in statistical control? What control procedure would you recommend for future production? Please include all necessary code and chart to solve the problem.

Homework Answers
The p-chart is used to plot the proportion of nonconformities,
The control chart is plotted in Rstudio. The R code is shown below,
R code:

>p.data=c(1,1,3,7,8,10,5,13,0,19,24,6,9,11,15,8,3,6,7,4,9,20)
>qcc(p.data,type="p", size=1000)
The screenshot for the p-chart is shown below,
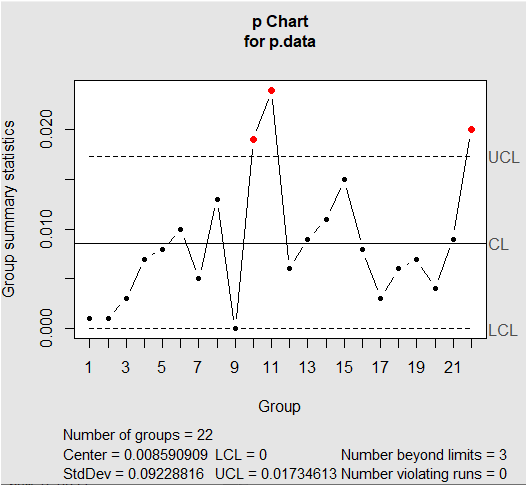
From the chart we can see that there are 3 samples are beyond the control limits hence the process is not in control.
{If you do not have install "qcc" package, please install by following code >install.packages("qcc") )
Add Answer to:
The data in the table below represents the number of nonconformities per 1000 meters in telephone cable. Using R languag...
The data in the table below represent the number of nonconformities per 1000 meters in telephone...
The data in the table below represent the number of nonconformities per 1000 meters in telephone cable. Sample Number Number of Nonconformities Sample Number Number of Nonconformities 1 1 12 6 2 1 13 9 3 3 14 11 4 7 15 15 5 8 16 8 6 10 17 3 7 5 18 6 8 13 19 7 9 0 20 4 10 19 21 9 11 24 22 20 Construct ‘c’ Chart for nonconformities for these data. Step...
The number of nonconformities found on final inspection of a CD deck is shown in Table...
The number of nonconformities found on final inspection of a CD deck is shown in Table below. a) Can you conclude that the process is in statistical control? b) What center line and control limits would you recommend for controlling future production? CD Deck Number Number of Nonconformities 1 0 2 1 3 1 4 0 5 2 6 1 7 1 8 3 9 2 10 1 11 0 12 3 13 2 14 5 15 1 16 2...
A paper mill uses a control chart to Data on Imperfections in Rolls of Paper monitor...
 A paper mill uses a control chart to Data on Imperfections in Rolls of Paper monitor the imperfection in finished Total Total Ils of paper. Production output is umber Number of Number Number of of Rolls Imper- Day Produced fections Day Produced fections inspected for twenty days, and the resulting data are shown here. Use these data to set up a control chart for 218 4 12 18 14 nonconformities per roll of paper. Does the process appear to be...
The dataset below is the observed number of defects from inspecting 25 successive wafers each containing...
 The dataset below is the observed number of defects from inspecting 25 successive wafers each containing n= 100 chips. Here the wafer is the inspection unit. (a) Create the appropriate control chart to control the data. (b) From the control chart, would you conclude that the process is in statistical control? (c) If any out of control points by Western Electric runs rule 1 are observed, assume they have assignable causes and can be omitted from control limit estimates. Create...
Problem 3 20 points A bank has compiled the data in the following table showing the...
 Problem 3 20 points A bank has compiled the data in the following table showing the count of nonconformities for 80.000 accounting transactions per day during December and January. Determine the trial c line and control limits and the revised central line and control limits, assuming that out-of. control points have assignable causes. (use c chart) Subgroup 13 Subgroup 14 Subgroup 15 Subgroup 16 Subgroup 17 Subgroup 18 19 Subgroup Subgroup 2 Subgroup 3 19 20 Sub 18 2. Subgroup...
5. Download the file, Plates.csv, from Sakai. This file contains data about twenty five steel plates....
 5. Download the file, Plates.csv, from Sakai. This file contains data about twenty five steel plates. There are two variables in this file, Plate and Defects. The variable, Defects, contains the number of nonconformities on each plate. Convert the data as appropriate for analysis in either SAS or R. Make the appropriate control chart, and interpret your results Plates <- read.cs Plates Plate Defects ## 1 ## 2 3 ## 10 10 12 13 14 15 16 17 18 19...
The data shown in the table below are i and R values for 24 samples of...
 The data shown in the table below are i and R values for 24 samples of size n-5 taken from a process producing bearings. The measurements are made on the inside diameter of the bearing. with only the last three decimals recorded (fi.e., 34.5 should be 0.50345). Sample i Number Sample R Number 13 14 15 16 17 18 19 20 21 35.4 34.0 37.1 34.9 33.5 31.7 34.0 35.1 33.7 32.8 33.5 345 34.2 31.6 315 35.0 34.1 32.6...
Data was collected from a textile finishing process. Samples were collected daily and the number of...
Data was collected from a textile finishing process. Samples were collected daily and the number of nonconformities were recorded. (recall more than one nonconformity can be present on each unit) Day Number of units produced Number of Nonconformities 1 13 60 2 12 43 3 19 55 4 14 44 5 18 55 6 13 40 7 24 61 8 15 49 9 16 66 10 11 41 Using Minitab: 1. Construct an appropriate control chart for the above data....
Table (1) 1) The data shown in Table (1) are and R values for 24 samples...
 Table (1) 1) The data shown in Table (1) are and R values for 24 samples of size n 5 taken from a process Number producing bearings. The measurements are made on the inside diameter of the bearing, with only the last three decimals recorded (i.e, 34.5 should be0.50345). Bearing Diameter Data Sample Sample Number R 34.5 3 R 13 14 34.0 6 15 37.1 5 16 34.9 7 354 8 2 34.2 3 31.6 4 31.5 5 35.0 5...
Please write in the answer clear. Will leave like if its correct . Age Gen Sibs Work Exercise Units Mom 18 M 1 20 10 15 6 17 F 3 0 7 15 14 23 M...
 Please write in the answer clear. Will leave like if its
correct
.
Age
Gen
Sibs
Work
Exercise
Units
Mom
18
M
1
20
10
15
6
17
F
3
0
7
15
14
23
M
3
20
5
13
8
20
M
2
0
5
15
16
18
F
4
22
6
16
9
20
F
2
11
7
20
20
34
F
1
48
10
10
18
22
F
3
37
13
13
18
19
M
3
0...
Please write in the answer clear. Will leave like if its
correct
.
Age
Gen
Sibs
Work
Exercise
Units
Mom
18
M
1
20
10
15
6
17
F
3
0
7
15
14
23
M
3
20
5
13
8
20
M
2
0
5
15
16
18
F
4
22
6
16
9
20
F
2
11
7
20
20
34
F
1
48
10
10
18
22
F
3
37
13
13
18
19
M
3
0...
 A paper mill uses a control chart to Data on Imperfections in Rolls of Paper monitor the imperfection in finished Total Total Ils of paper. Production output is umber Number of Number Number of of Rolls Imper- Day Produced fections Day Produced fections inspected for twenty days, and the resulting data are shown here. Use these data to set up a control chart for 218 4 12 18 14 nonconformities per roll of paper. Does the process appear to be...
 The dataset below is the observed number of defects from inspecting 25 successive wafers each containing n= 100 chips. Here the wafer is the inspection unit. (a) Create the appropriate control chart to control the data. (b) From the control chart, would you conclude that the process is in statistical control? (c) If any out of control points by Western Electric runs rule 1 are observed, assume they have assignable causes and can be omitted from control limit estimates. Create...
 Problem 3 20 points A bank has compiled the data in the following table showing the count of nonconformities for 80.000 accounting transactions per day during December and January. Determine the trial c line and control limits and the revised central line and control limits, assuming that out-of. control points have assignable causes. (use c chart) Subgroup 13 Subgroup 14 Subgroup 15 Subgroup 16 Subgroup 17 Subgroup 18 19 Subgroup Subgroup 2 Subgroup 3 19 20 Sub 18 2. Subgroup...
 5. Download the file, Plates.csv, from Sakai. This file contains data about twenty five steel plates. There are two variables in this file, Plate and Defects. The variable, Defects, contains the number of nonconformities on each plate. Convert the data as appropriate for analysis in either SAS or R. Make the appropriate control chart, and interpret your results Plates <- read.cs Plates Plate Defects ## 1 ## 2 3 ## 10 10 12 13 14 15 16 17 18 19...
 The data shown in the table below are i and R values for 24 samples of size n-5 taken from a process producing bearings. The measurements are made on the inside diameter of the bearing. with only the last three decimals recorded (fi.e., 34.5 should be 0.50345). Sample i Number Sample R Number 13 14 15 16 17 18 19 20 21 35.4 34.0 37.1 34.9 33.5 31.7 34.0 35.1 33.7 32.8 33.5 345 34.2 31.6 315 35.0 34.1 32.6...
 Table (1) 1) The data shown in Table (1) are and R values for 24 samples of size n 5 taken from a process Number producing bearings. The measurements are made on the inside diameter of the bearing, with only the last three decimals recorded (i.e, 34.5 should be0.50345). Bearing Diameter Data Sample Sample Number R 34.5 3 R 13 14 34.0 6 15 37.1 5 16 34.9 7 354 8 2 34.2 3 31.6 4 31.5 5 35.0 5...
 Please write in the answer clear. Will leave like if its
correct
.
Age
Gen
Sibs
Work
Exercise
Units
Mom
18
M
1
20
10
15
6
17
F
3
0
7
15
14
23
M
3
20
5
13
8
20
M
2
0
5
15
16
18
F
4
22
6
16
9
20
F
2
11
7
20
20
34
F
1
48
10
10
18
22
F
3
37
13
13
18
19
M
3
0...
Please write in the answer clear. Will leave like if its
correct
.
Age
Gen
Sibs
Work
Exercise
Units
Mom
18
M
1
20
10
15
6
17
F
3
0
7
15
14
23
M
3
20
5
13
8
20
M
2
0
5
15
16
18
F
4
22
6
16
9
20
F
2
11
7
20
20
34
F
1
48
10
10
18
22
F
3
37
13
13
18
19
M
3
0...
Most questions answered within 3 hours.
-
If a block of Si is doped with 10^17 Boron atom/cm^3 and 5X10^16
Arsenic atoms/cm^3,
(a)...
asked 10 minutes ago -
Why would natural selection not minimize costs (in the form of
symptoms) of evolved defenses? (choose...
asked 28 minutes ago -
What is true about a critical task?
Latest finish time - latest start time = 0...
asked 30 minutes ago -
A company uses a
process costing system. Its Assembly Department's beginning
inventory consisted of 56,800 units,...
asked 30 minutes ago -
a
sealed glass cylinder contains 325 g of N2 gas at 1.02 atm at 20 c....
asked 34 minutes ago -
The main difference between an equity and a nonequity alliance
is that
A
equity alliances are...
asked 32 minutes ago -
Need help with this, in JAVA, using netbeans. A
complete response will receive a positive comment...
asked 41 minutes ago -
An imprest petty cash fund of $600 was established for minor
disbursements. At the end of...
asked 46 minutes ago -
Sharpe Cutter is a small company that produces specialty knives
for paper cutting machinery. The annual...
asked 50 minutes ago -
Calculating the Ka of a weak acid from
pH:
The pH of a 0.68M solution of...
asked 51 minutes ago -
1.What process is pushing back against gravity in the very
center (the core) of sun-like stars?...
asked 1 hour ago -
This question is from the textbook "Python for ArcGIS" by Laura
Tateosian:
Write a script "triangles.py"...
asked 1 hour ago