

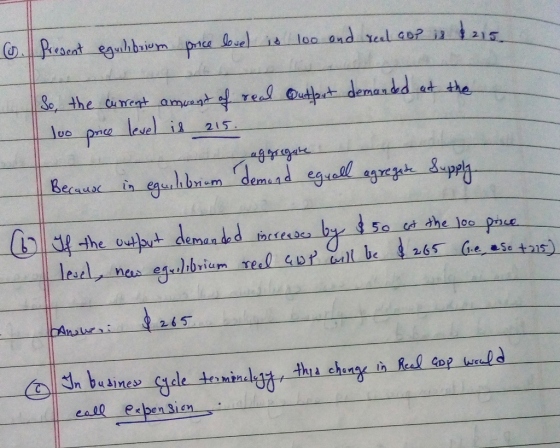
b If the amount of output demanded increases by $50 at the 100 price levels shown in C, what would be the new equilibrium real GDP? n business cycle terminology, what would economists call this change in real GDP? (Click to select
Homework Answers
Add Answer to:
Refer to the data in the table below. Suppose that the present equilibrium price level and level of real GDP are 100 an...
4. The following table contains hypothetical information about real GDP (billions of dollars) and the price...
 4. The following table contains hypothetical information about real GDP (billions of dollars) and the price level index (P): AD P SRAS $270 160 $330 290 140 310 310 120 290 330 100 270 350 80 250 a. Plot the data in an aggregate demand/aggregate supply diagram. What is the current equilibrium level of real GDP? The price level? b. What is the current value of nominal GDP? c. Suppose the level of full-employment real GDP is $320 billion. Add...
Real GDP demanded Real GDP supplied Short run Long run (dollars) (dollars) Price level (dollars) 700...
 Real GDP demanded Real GDP supplied Short run Long run (dollars) (dollars) Price level (dollars) 700 90 300 600 100 600 400 600 110 500 500 600 120 400 600 600 The table above gives the aggregate demand and aggregate supply schedules in Lotus Land. In short -run equilibrium, there is __---- 1) an inflationary gap of $100 2) a recessionary gap of $100 3) a recessionary gap of $200 4) an inflationary gap of $200
The graph models an economy in equilibrium with a real GDP of $180 billion. Suppose that...
 The graph models an economy in equilibrium with a real GDP of $180 billion. Suppose that consumers' expectations about future incomes change, causing unplanned inventory investment to increase by $30 billion. Shift the planned agregate expenditure (AE) line to show the effect of this change. Planned aggregate spending (billions of dollars) 0 30 240 270 300 60 90 120 150 180 210 Real GDP billions of dollars) Planned aggregate spendin 0 30 60 90 120 150 180 210 Real GDP...
Use the aggregate supply (AS) curve and aggregate demand (AD) curve below to determine the equilibrium price level and equilibrium real GDP for this economy.
 Use the aggregate supply (AS) curve and aggregate demand (AD) curve below to determine the equilibrium price level and equilibrium real GDP for this economy.
9. Refer to the below table. For the open economy, the equilibrium GDP is domestic output...
9. Refer to the below table. For the open economy, the equilibrium GDP is domestic output AE, closed economy exports imports 200 230 30 20 250 270 30 20 300 310 30 20 350 350 30 20 400 390 30 20 450 430 30 20 500 470 30 20 A) $300 B) $350 C) $400 D) $450 10. If net exports decline from zero to some negative amount, the aggregate expenditures schedule would A) shift upward B) shift downward C)...
150 Price level (GDP defa 200/100 LAS 140 SAS How does an increase in autonomous expenditure...
 150 Price level (GDP defa 200/100 LAS 140 SAS How does an increase in autonomous expenditure change real GDP in the short run? Does real GDP charge by the same amount as the change in aggregate demand? Why or why not? Use the graph to answer these questions AD, is the aggregate demand curve when investment is $10 milion Investment increases to $1.5 trilion, and the multiplier when the price level is constantis Draw the new aggregate demand curve and...
Suppose the current level of real GDP for an economy is below its potential level of...
Suppose the current level of real GDP for an economy is below its potential level of RGDP. Starting with this situation, and in the absence of any government action, what should next happen in the AD-AS model? Group of answer choices A. A decrease in the Long-Run Aggregate Supply B. An increase in Aggregate Demand C. A decrease in Aggregate Demand D. An increase in the Short-Run Aggregate Supply E. An increase in the Long-Run Aggregate Supply F. A decrease...
Answer the following questions on the basis of the three sets of data for the country...
 Answer the following questions on the basis of the three sets of data for the country of North Vaudeville Real GDP 235 235 235 235 Real GDPPrice Level Price Level Real GDP Price Level 100 100 100 100 210 235 260 285 110 100 95 90 110 100 95 90 285 260 235 210 a. Which set of data illustrates aggregate supply in the immediate short-run in North Vaudeville? The data in (Click to select Which set of data illustrates...
The following table shows the real output demanded and supplied at various price levels in a...
The following table shows the real output demanded and supplied at various price levels in a hypothetical economy. Real Output Demanded Price Level Real Output Supplied (Billions of dollars) (Index number) (Billions of dollars) 40 160 340 80 120 320 120 80 280 200 40 200 320 20 80 On the following graph, use the blue points (circle symbol) to plot the aggregate demand (Initial AD) curve for the economy. Then use the orange points (square symbol) to plot the...
Thank You! QUESTION 30 Aggregate price level x Real GDP in the price level and a...
 Thank You!
QUESTION 30 Aggregate price level x Real GDP in the price level and a decrease in the In the Aggregate Demand and Supply model (shown), an increase in nominal wages would cause an increase equilibrium level or real GDP in the short run. QUESTION 31 Aggregate price level Real GDP In the Aggregate Demand and Supply model (shown), if the government's budget deficit increases as a result of a tax cut with no cuts in spending, the result...
Thank You!
QUESTION 30 Aggregate price level x Real GDP in the price level and a decrease in the In the Aggregate Demand and Supply model (shown), an increase in nominal wages would cause an increase equilibrium level or real GDP in the short run. QUESTION 31 Aggregate price level Real GDP In the Aggregate Demand and Supply model (shown), if the government's budget deficit increases as a result of a tax cut with no cuts in spending, the result...
 4. The following table contains hypothetical information about real GDP (billions of dollars) and the price level index (P): AD P SRAS $270 160 $330 290 140 310 310 120 290 330 100 270 350 80 250 a. Plot the data in an aggregate demand/aggregate supply diagram. What is the current equilibrium level of real GDP? The price level? b. What is the current value of nominal GDP? c. Suppose the level of full-employment real GDP is $320 billion. Add...
 Real GDP demanded Real GDP supplied Short run Long run (dollars) (dollars) Price level (dollars) 700 90 300 600 100 600 400 600 110 500 500 600 120 400 600 600 The table above gives the aggregate demand and aggregate supply schedules in Lotus Land. In short -run equilibrium, there is __---- 1) an inflationary gap of $100 2) a recessionary gap of $100 3) a recessionary gap of $200 4) an inflationary gap of $200
 The graph models an economy in equilibrium with a real GDP of $180 billion. Suppose that consumers' expectations about future incomes change, causing unplanned inventory investment to increase by $30 billion. Shift the planned agregate expenditure (AE) line to show the effect of this change. Planned aggregate spending (billions of dollars) 0 30 240 270 300 60 90 120 150 180 210 Real GDP billions of dollars) Planned aggregate spendin 0 30 60 90 120 150 180 210 Real GDP...
 150 Price level (GDP defa 200/100 LAS 140 SAS How does an increase in autonomous expenditure change real GDP in the short run? Does real GDP charge by the same amount as the change in aggregate demand? Why or why not? Use the graph to answer these questions AD, is the aggregate demand curve when investment is $10 milion Investment increases to $1.5 trilion, and the multiplier when the price level is constantis Draw the new aggregate demand curve and...
 Answer the following questions on the basis of the three sets of data for the country of North Vaudeville Real GDP 235 235 235 235 Real GDPPrice Level Price Level Real GDP Price Level 100 100 100 100 210 235 260 285 110 100 95 90 110 100 95 90 285 260 235 210 a. Which set of data illustrates aggregate supply in the immediate short-run in North Vaudeville? The data in (Click to select Which set of data illustrates...
 Thank You!
QUESTION 30 Aggregate price level x Real GDP in the price level and a decrease in the In the Aggregate Demand and Supply model (shown), an increase in nominal wages would cause an increase equilibrium level or real GDP in the short run. QUESTION 31 Aggregate price level Real GDP In the Aggregate Demand and Supply model (shown), if the government's budget deficit increases as a result of a tax cut with no cuts in spending, the result...
Thank You!
QUESTION 30 Aggregate price level x Real GDP in the price level and a decrease in the In the Aggregate Demand and Supply model (shown), an increase in nominal wages would cause an increase equilibrium level or real GDP in the short run. QUESTION 31 Aggregate price level Real GDP In the Aggregate Demand and Supply model (shown), if the government's budget deficit increases as a result of a tax cut with no cuts in spending, the result...
Most questions answered within 3 hours.
-
Calculate the pH of each of the following solutions.
0.50 M HBr
3.1×10⁻⁴ M KOH
4.2×10⁻⁵...
asked 1 hour ago -
For the year ended December 31, Depot Max’s cost of merchandise
sold was $85,600. Inventory at the...
asked 1 hour ago -
Week 10 - Professional Memo Assignment
Professional Memo Assignment
Your mission for this week, should you...
asked 1 hour ago -
Write a Python program that stores the data for each
player on the team, and it...
asked 1 hour ago -
In
the last 3 months, mike never knows when he is going to get his
allowance...
asked 2 hours ago -
Is Ca(OH)2 a Bronsted base, Lewis base, or both? Why?
asked 2 hours ago -
1A- Why don’t voters complain about U.S. tariffs on imported
sugar?
Because sugar is only a...
asked 2 hours ago -
Cash Payback Period
Primera Banco is evaluating two capital investment proposals for
a drive-up ATM kiosk,...
asked 2 hours ago -
Create a button in Swift (Xcode) that will create a charge,
create a charge using Stripe's...
asked 2 hours ago -
The reaction rate of CO and NO2 in the reaction
CO(g) + NO2(g) → CO2(g) +...
asked 2 hours ago -
Imagine that a chemist puts 6.40 mol each of
C3H8 and O2 in a 1.00-L container...
asked 2 hours ago -
How much money should be invested today in order to have $8340
at the end of...
asked 2 hours ago