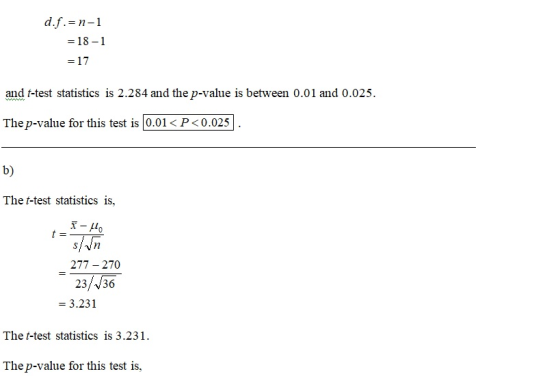
Consider the following hypotheses:
H0: μ ≤ 270
HA: μ > 270
Find the p-value for this test based on the following sample information. (You may find it useful to reference the appropriate table: z table or t table)
a. x¯x¯ = 277; s = 23; n = 18
- 0.025
 p-value < 0.05
 - 0.01
p-value < 0.025
- p-value
 0.10
0.10 - 0.05
p-value < 0.10
-
p-value < 0.01
 p-value < 0.05
 0.10
0.10b. x¯x¯ = 277; s = 23; n = 36
- p-value
0.10
- 0.025
p-value < 0.05
- 0.05
p-value < 0.10
-
p-value < 0.01
- 0.01
p-value < 0.025
c. x¯x¯ = 277; s = 14; n = 11
- 0.05
p-value < 0.10
- p-value
0.10
-
p-value < 0.01
-
0.01
p-value < 0.025 - 0.025
p-value < 0.05
d. x¯x¯ = 275; s = 14; n = 11
- 0.01
p-value < 0.025
-
p-value < 0.01
- p-value
0.10
- 0.05 p-value
< 0.10
- 0.025
p-value < 0.05
Homework Answers


Add Answer to:
Consider the following hypotheses: H0: μ ≤ 270 HA: μ > 270 Find the p-value for this test based on the following samp...
Consider the following hypotheses: H0: μ ≤ 610 HA: μ > 610 Find the p-value for...
 Consider the following hypotheses: H0: μ ≤ 610 HA: μ > 610
Find the p-value for this test based on the following sample
information. (You may find it useful to reference the appropriate
table: z table or t table)
a. x¯ = 618; s = 24; n = 26
p-value 0.10
0.05p-value
< 0.10
0.01
p-value < 0.025
p-value < 0.01
0.025 p-value < 0.05
b. x¯ = 618; s = 24; n = 52
0.025p-value
< 0.05
p-value
0.10...
Consider the following hypotheses: H0: μ ≤ 610 HA: μ > 610
Find the p-value for this test based on the following sample
information. (You may find it useful to reference the appropriate
table: z table or t table)
a. x¯ = 618; s = 24; n = 26
p-value 0.10
0.05p-value
< 0.10
0.01
p-value < 0.025
p-value < 0.01
0.025 p-value < 0.05
b. x¯ = 618; s = 24; n = 52
0.025p-value
< 0.05
p-value
0.10...
Consider the following hypotheses: H0: μ ≤ 420 HA: μ > 420 Find the p-value for...
Consider the following hypotheses: H0: μ ≤ 420 HA: μ > 420 Find the p-value for this test based on the following sample information. (You may find it useful to reference the appropriate table: z table or t table) a. x¯ = 430; s = 41; n = 13 p-value 0.10 0.05 p-value < 0.10 0.025 p-value < 0.05 0.01 p-value < 0.025 p-value < 0.01 b. x¯ = 430; s = 41; n = 26 0.025 p-value < 0.05...
Consider the following hypotheses: H0: μ ≤ 210 HA: μ > 210 Find the p-value for...
Consider the following hypotheses: H0: μ ≤ 210 HA: μ > 210 Find the p-value for this test based on the following sample information. (You may find it useful to reference the appropriate table: z table or t table) a. x⎯⎯x¯ = 216; s = 26; n = 40 p-value < 0.01 0.01 ≤ p-value < 0.025 0.025 ≤ p-value < 0.05 0.05 ≤ p-value < 0.10 p-value ≥ 0.10 b. x⎯⎯x¯ = 216; s = 26; n = 80...
Consider the following hypotheses: H0: μ = 70 HA: μ ≠ 70 Find the p-value for...
Consider the following hypotheses: H0: μ = 70 HA: μ ≠ 70 Find the p-value for this test based on the following sample information. (You may find it useful to reference the appropriate table: z table or t table) a. x¯ = 66; s = 10.9; n = 19 A. p-value 0.10 B. 0.02 p-value < 0.05 C. 0.01 p-value < 0.02 D. 0.05 p-value < 0.10 E. p-value < 0.01 b. x¯ = 74; s = 10.9; n = 19 A. p-value 0.10 B....
Consider tlowing hypotheses: H0: μ-12 HA12 Find the p-value for this test based on the following...
 Consider tlowing hypotheses: H0: μ-12 HA12 Find the p-value for this test based on the following sample information. (You may find it useful to reference the appropriate table: z table or t table) a. X-11:s-3.2; n-36 Op-value<0.01 0.01 s p-value0.02 0.02 s p-value0.05 0.05 s p-value<0.10 O p-value 2 0.10 b. X = 13, s= 3.2; n= 36 p-value <0.01 0.01 s p-value0.02 0.02 s p-value<0.05 0.05 s p-value<0.10 p-value 20.10 C. X = 11, s = 2.8; n =...
Consider the following competing hypotheses: H0: ρxy ≥ 0 HA: ρxy < 0 The sample consists of 30 observations and the sample correlation coefficient is –0.46. [You may find it useful to reference t...
 Consider the following competing hypotheses:
H0: ρxy ≥ 0
HA: ρxy < 0
The sample consists of 30 observations and the sample correlation
coefficient is –0.46. [You may find it useful to reference
the t table.]
a-1. Calculate the value of the test statistic.
(Round intermediate calculations to at least 4 decimal
places and final answer to 3 decimal places.)
a-2. Find the p-value.
p-value < 0.01
p-value
0.10
0.05
p-value < 0.10
0.025
p-value < 0.05
0.01
p-value <...
Consider the following competing hypotheses:
H0: ρxy ≥ 0
HA: ρxy < 0
The sample consists of 30 observations and the sample correlation
coefficient is –0.46. [You may find it useful to reference
the t table.]
a-1. Calculate the value of the test statistic.
(Round intermediate calculations to at least 4 decimal
places and final answer to 3 decimal places.)
a-2. Find the p-value.
p-value < 0.01
p-value
0.10
0.05
p-value < 0.10
0.025
p-value < 0.05
0.01
p-value <...
Consider the following hypotheses: H0: μ ≥ 160 HA: μ < 160 The population is normally...
Consider the following hypotheses: H0: μ ≥ 160 HA: μ < 160 The population is normally distributed. A sample produces the following observations: 152 138 151 144 151 142 Conduct the test at the 1% level of significance. (You may find it useful to reference the appropriate table: z table or t table) a. Calculate the value of the test statistic. (Negative value should be indicated by a minus sign. Round intermediate calculations to at least 4 decimal places and...
Consider the following hypotheses: H0: μ = 19 HA: μ ≠ 19 The population is normally...
Consider the following hypotheses: H0: μ = 19 HA: μ ≠ 19 The population is normally distributed. A sample produces the following observations: (You may find it useful to reference the appropriate table: z table or t table) 20 23 17 21 21 24 23 Click here for the Excel Data File a. Find the mean and the standard deviation. (Round your answers to 2 decimal places.) b. Calculate the value of the test statistic. (Round intermediate calculations to...
Consider the following hypotheses не: 78 HA: μ * 78 Find the p-value for this test...
 Consider the following hypotheses не: 78 HA: μ * 78 Find the p-value for this test based on the following sample information. (You may find It useful to reference the approprlate toble: z teble or t teble) 0.01 s p-value <0.02 O p-value<0.01 0.05 s p-value <0.10 0.02 s p-value <O.05 p-value 0.10 O p-value 0.10 0.05 s p-value <0.10 0.02 s p-value <O.05 0.01 s p-value <0.02 O p-value<0.01 c. z = 64: s = 10.0: n= 14 0.05...
Consider the following hypotheses: Ho: μ.. 27 Find the p-value for this test based on the...
 Consider the following hypotheses: Ho: μ.. 27 Find the p-value for this test based on the following sample information. (You may find it useful to reference the appropriate table: table or ttable) 0.01 s p-value < 0.02 p-value 2 0.10 0.02 s p-value<0.05 O p-value < 0.01 0.05 s p-value < 0.10 b. x = 29, s= 6.6; n= 31 。p-value 0.10 0.05 s p-value<0.10 0 0.02 p-value < 0.05 0.01 s p-value <0.02 Op-value < 0.01 c, x =...
 Consider the following hypotheses: H0: μ ≤ 610 HA: μ > 610
Find the p-value for this test based on the following sample
information. (You may find it useful to reference the appropriate
table: z table or t table)
a. x¯ = 618; s = 24; n = 26
p-value 0.10
0.05p-value
< 0.10
0.01
p-value < 0.025
p-value < 0.01
0.025 p-value < 0.05
b. x¯ = 618; s = 24; n = 52
0.025p-value
< 0.05
p-value
0.10...
Consider the following hypotheses: H0: μ ≤ 610 HA: μ > 610
Find the p-value for this test based on the following sample
information. (You may find it useful to reference the appropriate
table: z table or t table)
a. x¯ = 618; s = 24; n = 26
p-value 0.10
0.05p-value
< 0.10
0.01
p-value < 0.025
p-value < 0.01
0.025 p-value < 0.05
b. x¯ = 618; s = 24; n = 52
0.025p-value
< 0.05
p-value
0.10...
 Consider tlowing hypotheses: H0: μ-12 HA12 Find the p-value for this test based on the following sample information. (You may find it useful to reference the appropriate table: z table or t table) a. X-11:s-3.2; n-36 Op-value<0.01 0.01 s p-value0.02 0.02 s p-value0.05 0.05 s p-value<0.10 O p-value 2 0.10 b. X = 13, s= 3.2; n= 36 p-value <0.01 0.01 s p-value0.02 0.02 s p-value<0.05 0.05 s p-value<0.10 p-value 20.10 C. X = 11, s = 2.8; n =...
 Consider the following competing hypotheses:
H0: ρxy ≥ 0
HA: ρxy < 0
The sample consists of 30 observations and the sample correlation
coefficient is –0.46. [You may find it useful to reference
the t table.]
a-1. Calculate the value of the test statistic.
(Round intermediate calculations to at least 4 decimal
places and final answer to 3 decimal places.)
a-2. Find the p-value.
p-value < 0.01
p-value
0.10
0.05
p-value < 0.10
0.025
p-value < 0.05
0.01
p-value <...
Consider the following competing hypotheses:
H0: ρxy ≥ 0
HA: ρxy < 0
The sample consists of 30 observations and the sample correlation
coefficient is –0.46. [You may find it useful to reference
the t table.]
a-1. Calculate the value of the test statistic.
(Round intermediate calculations to at least 4 decimal
places and final answer to 3 decimal places.)
a-2. Find the p-value.
p-value < 0.01
p-value
0.10
0.05
p-value < 0.10
0.025
p-value < 0.05
0.01
p-value <...
 Consider the following hypotheses не: 78 HA: μ * 78 Find the p-value for this test based on the following sample information. (You may find It useful to reference the approprlate toble: z teble or t teble) 0.01 s p-value <0.02 O p-value<0.01 0.05 s p-value <0.10 0.02 s p-value <O.05 p-value 0.10 O p-value 0.10 0.05 s p-value <0.10 0.02 s p-value <O.05 0.01 s p-value <0.02 O p-value<0.01 c. z = 64: s = 10.0: n= 14 0.05...
 Consider the following hypotheses: Ho: μ.. 27 Find the p-value for this test based on the following sample information. (You may find it useful to reference the appropriate table: table or ttable) 0.01 s p-value < 0.02 p-value 2 0.10 0.02 s p-value<0.05 O p-value < 0.01 0.05 s p-value < 0.10 b. x = 29, s= 6.6; n= 31 。p-value 0.10 0.05 s p-value<0.10 0 0.02 p-value < 0.05 0.01 s p-value <0.02 Op-value < 0.01 c, x =...
Most questions answered within 3 hours.
-
Consider the competitive environment of Starbuck's, Progressive
Insurance, a manufacturing firm with low turnover, or a...
asked 12 minutes ago -
3. Gains from trade
Consider two neighbouring island countries called Euphoria and
Contente. They each have...
asked 2 hours ago -
A business executive has the option to invest money in two
plans: Plan A guarantees that...
asked 4 hours ago -
Hello, can someone please help me answer this question?
How much heat is absorbed by a...
asked 4 hours ago -
. A marketing researcher conducted a survey of 25 shoppers
randomly selected at the local mall...
asked 4 hours ago -
Create an comprehensive response to the
following:
Antimicrobial agents work on a multitude of microbes (bacteria,...
asked 4 hours ago -
6.13 LAB: Step counter. Section 6.3.
A pedometer treats walking 2,000 steps as walking 1 mile....
asked 4 hours ago -
(14.2) A block of mass m = 10 kg riding on a frictionless
horizontal plane is...
asked 4 hours ago -
Use any search engine to search for articles about Starbucks
partnership with Tata Companies in India...
asked 4 hours ago -
Let’s say that for some reason Bank Excess Reserves suddenly
increase sharply. What effect would this...
asked 4 hours ago -
Given:
Curent Assets: $600,000
Total Assets: $2,600,000
Current Liabilities: $500,000
Total Liabilities: $1,700,000
What is the...
asked 4 hours ago -
1. What is a “Bankster”? What is insider trading? Why is it
illegal?
2. What is...
asked 4 hours ago