please check I have included all data needed. 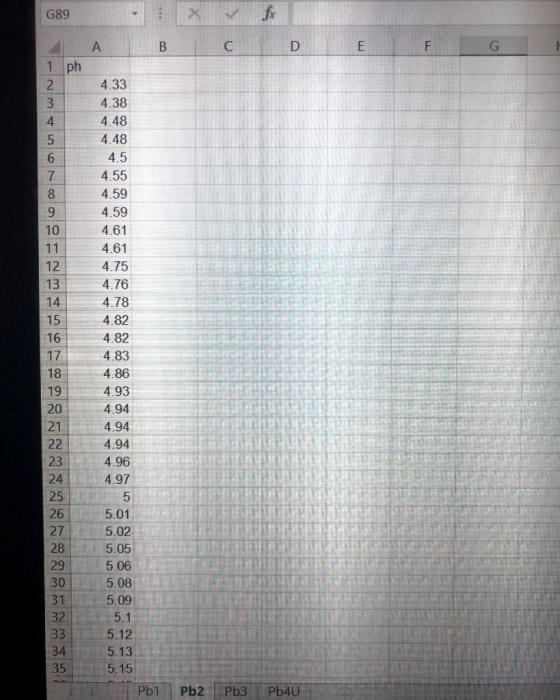


 Question 2. (Minitab or R and
Excel)
Question 2. (Minitab or R and
Excel)
Normal, clean rain has a pH value of between 5.0 and 5.5, which is slightly acidic. However, when rain combines with sulfur dioxide or nitrogen oxides— produced from power plants and automobiles—the rain becomes much more acidic. Typical acid rain has a pH value of 4.0. The data are the pH of precipitation observed in Colorado.
a) Make a histogram of the data in 3 ways: i. Minitab or R (not both) ii. Excel defaults iii. Excel with categories (bin ranges): 4.14, 4.34, 4.54, 4.74, 4.94, 5.14, 5.34, 5.54, 5.74, 5.94, 6.14, 6.34, 6.54, 6.74, 6.94, 7.14 iv. Excel with categories (bin ranges): 4.2, 4.4, 4.6, 4.8, 5.0, 5.2, 5.4, 5.6, 5.8, 6.0, 6.2, 6.4, 6.6, 6.8, 7.0. Put all four in your lab report.
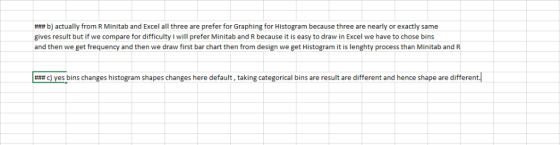
b) Briefly tell whether you prefer Minitab, R or Excel for histograms and why. Also comment on the default categories that Excel, R and Minitab give.
c) Do the categories make a difference in the shape of the histogram? Describe the shapes of the histograms and any differences that you see in the histograms.
CD 34 5.13 5.15 35 36 5.15 37 5.15 38 5.16 5.16 39 5.16 40 415.18 5.19 42 43 5.23 5.24 45 5.29 46 47 5.32 5.33 48 5.35 495.37 50 5.37 5.39 52 5.41 53 5.43 54 5.44 5.46 56 5.46 57 5.47 5.5 58 59 5.51 60 5.53 61 5.55 62 5.55 63 5.56 64 5.61 65 5.62 5.64 67 5.65 68 5.65
5677 8 975556698 111155996 7931 A555 555-555555 5.55-555 9 GE·68 69 70 72-73-74-56 2 9999 9 9 999 9.1 1 1 5678 90-123 789
31251 46668 0000000012 5-6-7 8 9-0 1-2-3-4 5 0:111(- 11 ▲ 848 86 88 90 91 92 93 94 95 96 97 98 99 100 5 6 7 8| 00123456789 8999999 999-9 0000 3
Homework Answers


### first graph from Minitab and all others are from Excel
Add Answer to:
please check I have included all data needed. Question 2. (Minitab or R and Excel) Normal, clean rain has a pH value of...
Please check I have Included all data. PleaseQuestion 3. (Excel) The data for this question are the Toxic Release Invent...
 Please check I have Included all data. PleaseQuestion
3. (Excel)
The data for this question are the Toxic Release Inventory
releases by large aquatic ecosystem in 2015. Make the following
charts in Excel:
a) Separate pie charts of air, water, land, and other releases
where the slices of the pie are ecosystems.
b) Side by side bar charts of air, water, land, and other
releases where the bars are ecosystems.
c) Side by side bar charts switching the row and...
Please check I have Included all data. PleaseQuestion
3. (Excel)
The data for this question are the Toxic Release Inventory
releases by large aquatic ecosystem in 2015. Make the following
charts in Excel:
a) Separate pie charts of air, water, land, and other releases
where the slices of the pie are ecosystems.
b) Side by side bar charts of air, water, land, and other
releases where the bars are ecosystems.
c) Side by side bar charts switching the row and...
Need to create pH vs. volume graph and fill out table from experimental data below. I have posted...
 Need to create pH vs. volume graph and fill out table
from experimental data below. I have posted the pH vs. volume graph
I have created, not sure if it is right, need to help finding
stoichiometric point. I am also required to fill out the table
posted below. MY LAB GROUP BAILED ON ME PLZ
HELP!!!!!!!!!!!!!!!!!!!!!!!!!
Volume (mL)
pH
0
4.24
1
4.28
2
4.33
3
4.37
4
4.4
5
4.45
6
4.49
7
4.52
8
4.55
9
4.58...
Need to create pH vs. volume graph and fill out table
from experimental data below. I have posted the pH vs. volume graph
I have created, not sure if it is right, need to help finding
stoichiometric point. I am also required to fill out the table
posted below. MY LAB GROUP BAILED ON ME PLZ
HELP!!!!!!!!!!!!!!!!!!!!!!!!!
Volume (mL)
pH
0
4.24
1
4.28
2
4.33
3
4.37
4
4.4
5
4.45
6
4.49
7
4.52
8
4.55
9
4.58...
 Please check I have Included all data. PleaseQuestion
3. (Excel)
The data for this question are the Toxic Release Inventory
releases by large aquatic ecosystem in 2015. Make the following
charts in Excel:
a) Separate pie charts of air, water, land, and other releases
where the slices of the pie are ecosystems.
b) Side by side bar charts of air, water, land, and other
releases where the bars are ecosystems.
c) Side by side bar charts switching the row and...
Please check I have Included all data. PleaseQuestion
3. (Excel)
The data for this question are the Toxic Release Inventory
releases by large aquatic ecosystem in 2015. Make the following
charts in Excel:
a) Separate pie charts of air, water, land, and other releases
where the slices of the pie are ecosystems.
b) Side by side bar charts of air, water, land, and other
releases where the bars are ecosystems.
c) Side by side bar charts switching the row and...
 Need to create pH vs. volume graph and fill out table
from experimental data below. I have posted the pH vs. volume graph
I have created, not sure if it is right, need to help finding
stoichiometric point. I am also required to fill out the table
posted below. MY LAB GROUP BAILED ON ME PLZ
HELP!!!!!!!!!!!!!!!!!!!!!!!!!
Volume (mL)
pH
0
4.24
1
4.28
2
4.33
3
4.37
4
4.4
5
4.45
6
4.49
7
4.52
8
4.55
9
4.58...
Need to create pH vs. volume graph and fill out table
from experimental data below. I have posted the pH vs. volume graph
I have created, not sure if it is right, need to help finding
stoichiometric point. I am also required to fill out the table
posted below. MY LAB GROUP BAILED ON ME PLZ
HELP!!!!!!!!!!!!!!!!!!!!!!!!!
Volume (mL)
pH
0
4.24
1
4.28
2
4.33
3
4.37
4
4.4
5
4.45
6
4.49
7
4.52
8
4.55
9
4.58...
Most questions answered within 3 hours.
-
A company just paid a dividend of $1.50 per share. The consensus
forecast of financial analysts...
asked 2 minutes ago -
What might be a negative mutation that would hinder the
bug population?
asked 6 minutes ago -
A mass of 0.50 g of an unknown acid HA required 20.0 mL of 0.25
M...
asked 11 minutes ago -
Mitch is a director and officer of Numero Uno, Inc. Mitch makes
a marketing decision that...
asked 12 minutes ago -
A pair of fair dice is tossed. Let X denote the larger of the
two numbers...
asked 20 minutes ago -
What are the variety of forms of products dispensed with aerosol
spray?
asked 24 minutes ago -
Which one of the following statements is true about C++
keywords?
a. A keyword can have...
asked 25 minutes ago -
Pyruvate Kinase, an allosteric enzyme, accelerates the
conversion of phosphoenolpyruvate to pyruvate.
1) Draw curves describing...
asked 27 minutes ago -
question 1
Which of the following is an example of a bottom-up technique
for developing promotional...
asked 44 minutes ago -
1)In FM modulation, what aspect of the carrier is being
modulated?
2)Explain in your own words,...
asked 41 minutes ago -
Andromeda Galaxy, M31, is considered a sister galaxy to Milky
Way galaxy. One similarirty is their...
asked 46 minutes ago -
How does temperature affect ADH during enzyme
kinetics?
asked 55 minutes ago