Finding the Equation of a Regression Line: Find the equation of the regression line for the data. Then construct a scatt...
Finding the Equation of a Regression Line: Find the equation of the regression line for the data. Then construct a scatter plot of the data and draw the regression line. (Each pair of variables has a significant correlation.) Then use the regression equation to predict the value of y for each of the x-values, if meaningful. If the x-value is not meaningful to predict the value of y, explain why not. If convenient, use technology.
Square Footage and Home Sale Price: The square footages and sale prices (in thousands of dollars) of seven homes are shown in the table below.
- X = 1450 sq ft. (b) X = 2720 sq ft. (c) X = 2175 sq ft. (d) X = 1890 sq ft.
|
X - Sq Ft. |
Y - Sale Price |
|
1924 |
174.9 |
|
1592 |
136.9 |
|
2413 |
275 |
|
2332 |
219.9 |
|
1552 |
120 |
|
1312 |
99.9 |
|
1287 |
145 |
Homework Answers
Sol:
In excel select the data.
Go to
Insert>scatterchart
You will get

Add axis titles,chart title
Click on one point
add trend line
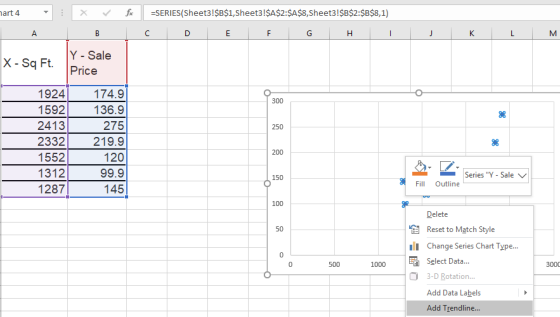
You get

Regression eq is
saleprice=0.1234*sqft-51.412
R sq=0.8581
=85.81% variation in sale price is explained by sq ft.
Good model.
when x= 1450 sq ft.
substitute in regression eq
y=0.1234*1450-51.412
y= 127.518
so sale price is 127.518
(b) X = 2720 sq ft
we cannot use this value as it is out of range for which we fit linear regression.
. (c) X = 2175 sq ft
y=0.1234*2175 -51.412
y= 216.983
when sq ft is 2175,sale price is 216.983
. (d) X = 1890 sq ft.
substitute in regression eq we get
y=0.1234*1890 -51.412
y= 181.814
when sq ft is 1890 ,sale price is 181.814
Add Answer to:
Finding the Equation of a Regression Line: Find the equation of the regression line for the data. Then construct a scatt...
519 Find the equation of the regression line for the given data. Then construct a scatter...
 519 Find the equation of the regression line for the given data. Then construct a scatter plot of the data and draw the regression line. (The pair of variables have a significant correlation.) Then use the regression equation to predict the value of y for each of the given x-values, if meaningful The table below shows the heights (in feet) and the number of stories of six notable buildings in a city Height, 778 621 510 494 473 (a) x...
Find the equation of the regression line for the given data. Then construct a scatter plot...
 Find the equation of the regression line for the given data. Then construct a scatter plot of the data and draw the regression line. (The pair of variables has a significant correlation.) Then use the regressiorn equation to predict the value of y for each of the given x-values, if meaningful. The table shows the shoe size and heights (in) for 6 men Shoe size: x-T8.5 110T15|130|135 (a) x=size 10 0 (b)x-size 10.5 3.5 745 725(c)x-s size 16.0 (d)x- size...
Find the equation of the regression line for the given data. Then construct a scatter plot...
 Find the equation of the regression line for the given data. Then construct a scatter plot of the data and draw the regression line. (The pair of variables have a significant correlation.) Then use the regression equation to predict the value of y for each of the given x-values, if meaningful. The number of hours 6 students spent for a test and their scores on that test are shown below. Hours spent studying, X 2 5 5 (a) x =...
Find the equation of the regression line for the given data. Then construct a scatter plot...
 Find the equation of the regression line for the given data. Then construct a scatter plot of the data and draw the regression line. (The pair of variables have a significa correlation.) Then use the regression equation to predict the value of y for each of the given x-values, if meaningful. The table below shows the heights (in feet) and the number of stories of six notable buildings in a city. Height, x 758 621 518 510 492 483 (a)...
Find the equation of the regression line for the given data. Then construct a scatter plot...
Find the equation of the regression line for the given data. Then construct a scatter plot of the data and draw the regression line. (The pair of variables have a significant correlation.) Then use the regression equation to predict the value of y for each of the given x-values, if meaningful. The table below shows the heights (in feet) and the number of stories of six notable buildings in a city. Height comma xHeight, x 764 625 520 510 492...
0 Find the equation of the regression line for the given data. The construct a scatter...
 0 Find the equation of the regression line for the given data. The construct a scatter plot of the date and draw the regression in (The pair of we have a significant corelation) Then use the regression equation to predict the value ofy for each of the given x-vous meaningful. The table below shows the heights on tool and the number of stories of si notable buildings in a city Helght, 775 510 500 (0) 500 fot b)x500 Stories 37...
Find the equation of the regression line for the given data. Then construct a scatter plot...
 Find the equation of the regression line for the given data. Then construct a scatter plot of the data and draw the regression line. (The pair of variables have a significant correlation.) Then use the regression equation to predict the value of y for each of the given x-values, if meaningful. The table below shows the heights (in feet) and the number of stories of six notable buildings in a city Height, x 768 628 518 511 491 478 (a)...
Find the equation of the regression line for the given data. Then construct a scatter plot...
 Find the equation of the regression line for the given data.
Then construct a scatter plot of the data and draw the regression
line. (The pair of variables have a significant correlation.) Then
use the regression equation to predict the value of y for each of
the given x-values, if meaningful. The number of hours 6 students
spent for a test and their scores on that test are shown below.
(a)
x=3hours
(b)
x=4.5hours
(c)
x=14hours
(d)
x=2.5hour
Find the...
Find the equation of the regression line for the given data.
Then construct a scatter plot of the data and draw the regression
line. (The pair of variables have a significant correlation.) Then
use the regression equation to predict the value of y for each of
the given x-values, if meaningful. The number of hours 6 students
spent for a test and their scores on that test are shown below.
(a)
x=3hours
(b)
x=4.5hours
(c)
x=14hours
(d)
x=2.5hour
Find the...
Find the equation of the regression line for the given data. Then construct a scatter plot...
 Find the equation of the regression line for the given data. Then construct a scatter plot of the data and draw the regression line. (The pair of variaties have a significant correlation) Then use the regression equation to predict the value of yo each of the given x-values, if meaningful. The table below shows the height in feet) and the number of stories of six notable buildings in a city Heights 772 5110 503 483 Stories 51 (a)x= 501 foot...
Find the equation of the regression line for the given data. Then construct a scatter plot...
 Find the equation of the regression line for the given data. Then construct a scatter plot of the given x-values, if meaningful. The table below shows the heights (in feet) and the number of stories of Height, Stories, y data and draw the regression line. (The pair of variables have a signiicant correlation.) Then use the regression equation to predict the value of y for each of the sb. notable buildings in a city 775 53 619 47 519 46...
 519 Find the equation of the regression line for the given data. Then construct a scatter plot of the data and draw the regression line. (The pair of variables have a significant correlation.) Then use the regression equation to predict the value of y for each of the given x-values, if meaningful The table below shows the heights (in feet) and the number of stories of six notable buildings in a city Height, 778 621 510 494 473 (a) x...
 Find the equation of the regression line for the given data. Then construct a scatter plot of the data and draw the regression line. (The pair of variables has a significant correlation.) Then use the regressiorn equation to predict the value of y for each of the given x-values, if meaningful. The table shows the shoe size and heights (in) for 6 men Shoe size: x-T8.5 110T15|130|135 (a) x=size 10 0 (b)x-size 10.5 3.5 745 725(c)x-s size 16.0 (d)x- size...
 Find the equation of the regression line for the given data. Then construct a scatter plot of the data and draw the regression line. (The pair of variables have a significant correlation.) Then use the regression equation to predict the value of y for each of the given x-values, if meaningful. The number of hours 6 students spent for a test and their scores on that test are shown below. Hours spent studying, X 2 5 5 (a) x =...
 Find the equation of the regression line for the given data. Then construct a scatter plot of the data and draw the regression line. (The pair of variables have a significa correlation.) Then use the regression equation to predict the value of y for each of the given x-values, if meaningful. The table below shows the heights (in feet) and the number of stories of six notable buildings in a city. Height, x 758 621 518 510 492 483 (a)...
 0 Find the equation of the regression line for the given data. The construct a scatter plot of the date and draw the regression in (The pair of we have a significant corelation) Then use the regression equation to predict the value ofy for each of the given x-vous meaningful. The table below shows the heights on tool and the number of stories of si notable buildings in a city Helght, 775 510 500 (0) 500 fot b)x500 Stories 37...
 Find the equation of the regression line for the given data. Then construct a scatter plot of the data and draw the regression line. (The pair of variables have a significant correlation.) Then use the regression equation to predict the value of y for each of the given x-values, if meaningful. The table below shows the heights (in feet) and the number of stories of six notable buildings in a city Height, x 768 628 518 511 491 478 (a)...
 Find the equation of the regression line for the given data.
Then construct a scatter plot of the data and draw the regression
line. (The pair of variables have a significant correlation.) Then
use the regression equation to predict the value of y for each of
the given x-values, if meaningful. The number of hours 6 students
spent for a test and their scores on that test are shown below.
(a)
x=3hours
(b)
x=4.5hours
(c)
x=14hours
(d)
x=2.5hour
Find the...
Find the equation of the regression line for the given data.
Then construct a scatter plot of the data and draw the regression
line. (The pair of variables have a significant correlation.) Then
use the regression equation to predict the value of y for each of
the given x-values, if meaningful. The number of hours 6 students
spent for a test and their scores on that test are shown below.
(a)
x=3hours
(b)
x=4.5hours
(c)
x=14hours
(d)
x=2.5hour
Find the...
 Find the equation of the regression line for the given data. Then construct a scatter plot of the data and draw the regression line. (The pair of variaties have a significant correlation) Then use the regression equation to predict the value of yo each of the given x-values, if meaningful. The table below shows the height in feet) and the number of stories of six notable buildings in a city Heights 772 5110 503 483 Stories 51 (a)x= 501 foot...
 Find the equation of the regression line for the given data. Then construct a scatter plot of the given x-values, if meaningful. The table below shows the heights (in feet) and the number of stories of Height, Stories, y data and draw the regression line. (The pair of variables have a signiicant correlation.) Then use the regression equation to predict the value of y for each of the sb. notable buildings in a city 775 53 619 47 519 46...
Most questions answered within 3 hours.
-
A cohort study is conducted to determine whether smoking is
associated with an increased risk of...
asked 6 seconds from now -
A statistics student finds herself struggling with a newspaper
article stating that only eighteen percent of...
asked 41 seconds ago -
Create the pseudo-code/flowchart for an application class named
Monogram. Its main() method inputs three variables that...
asked 25 seconds ago -
How many liters of water are required to dissolve 1.00 g of
silver chromate? Express your...
asked 3 minutes ago -
Hot: T_inlet = 80, T_out = 65
Cold: T_inlet = 10, T_out = 25
Explain in...
asked 3 minutes ago -
Two protons fly in different directions and collide. They both
have a total energy of 1.5...
asked 12 minutes ago -
What is the oxidation number of each atom in sodium phosphate,
Na3PO4?
>>> SHOW YOUR WORK...
asked 19 minutes ago -
D company purchased goods with a list price of $60000, subject
to trade discounts of 20%...
asked 21 minutes ago -
Transposable elements make up more than 40% of the human genome
and are inserted more-or-less randomly...
asked 32 minutes ago -
Can I get some samples of the following:
1) Write four sentences in first person, singular....
asked 37 minutes ago -
Described how search engines work. Be sure to describe in detail
.
asked 37 minutes ago -
The position of a particle as a function of time is given by
x=(2.0m/s)t+(−3.0m/s3)t^3. Part A...
asked 43 minutes ago