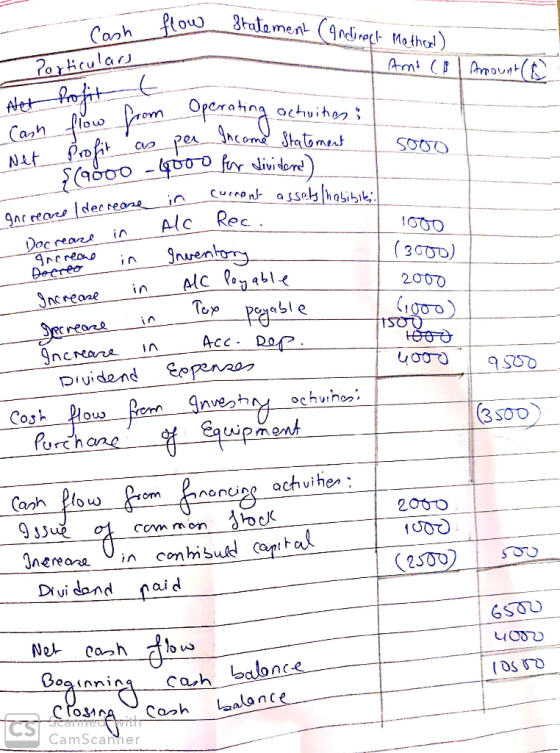
The Carpet Company’s 2019 and 2020 balance sheets included the following items: December 31 2020 2019 De...
The Carpet Company’s 2019 and 2020 balance sheets included the following items:
|
December 31 |
||
|
2020 |
2019 |
|
|
Debits |
||
|
Cash |
$10,500 |
$ 4,000 |
|
Accounts receivable |
8,000 |
9,000 |
|
Merchandise inventory |
21,000 |
18,000 |
|
Equipment |
18,000 |
15,000 |
|
Totals |
$57,500 |
$46,000 |
|
Credits |
||
|
Accumulated depreciation, equipment |
$ 4,000 |
$ 3,000 |
|
Accounts payable |
7,000 |
5,000 |
|
Taxes payable |
1,000 |
2,000 |
|
Dividends payable |
1,500 |
0 |
|
Common stock, $10 par value |
27,000 |
25,000 |
|
Contributed capital in excess of par, common stock |
6,000 |
5,000 |
|
Retained earnings |
11,000 |
6,000 |
|
Totals |
$57,500 |
$46,000 |
The Carpet Company’s income statement was as follows:
|
CARPET COMPANY |
||
|
Sales |
$61,000 |
|
|
Cost of goods sold |
$40,000 |
|
|
Wages and other operating expenses |
6,300 |
|
|
Income taxes expense |
4,200 |
|
|
Depreciation expense |
1,500 |
52,000 |
|
Net income |
$ 9,000 |
|
Required:
Prepare the statement of cash flows under both the direct method and the indirect method for the year ended December 31, 2020. Additional information includes the following:
- Equipment costing $3,500 was purchased during the year.
- Fully depreciated equipment that cost $500 was discarded and its cost and accumulated depreciation were removed from the accounts.
- Two hundred shares of stock were sold and issued at $15 per share.\
- The company declared $4,000 of cash dividends and paid $2,500.
Homework Answers


Add Answer to:
The Carpet Company’s 2019 and 2020 balance sheets included the following items: December 31 2020 2019 De...
Demonstration Problem Chapter 14 The Carpet Company's 2014 and 2015 balance sheets included the following items:...
 Demonstration Problem Chapter 14 The Carpet Company's 2014 and 2015 balance sheets included the following items: December 31 2015 2014 Debits $ 4,000 9,000 18,000 15,000 $46,000 $10,500 8,000 21,000 18,000 $57,500 Cash Accounts receivable Merchandise inventory Equipment.... Totals.. Credits $ 4,000 7,000 1,000 1,500 27,000 6,000 11,000 $57,500 $3,000 5,000 2,000 Accumulated depreciation, equipment. Accounts payable Taxes payable.. Dividends payable.. Common stock, $10 par value Contributed capital in excess of par, common stock Retained earnings. 25,000 5,000 6,000 $46,000...
The Pruitt Company’s income statement and comparative balance sheets as of December 31 of 2019 and...
The Pruitt Company’s income statement and comparative balance sheets as of December 31 of 2019 and 2018 follow: PRUITT COMPANY Income Statement For the Year Ended December 31, 2019 Sales Revenue $770,000 Cost of Goods Sold $450,000 Wages and Other Operating Expenses 195,000 Depreciation Expense 22,000 Goodwill Amortization Expense 7,000 Interest Expense 5,000 Income Tax Expense 36,000 Loss on Bond Retirement 5,000 720,000 Net Income $50,000 PRUITT COMPANY Balance Sheets Dec. 31, 2019 Dec. 31, 2018 Assets Cash $8,000 $19,000...
Presented here are the comparative balance sheets of Hames Inc. at December 31, 2020 and 2019....
 Presented here are the comparative balance sheets of Hames Inc. at December 31, 2020 and 2019. Sales for the year ended December 31, 2020, totaled $650,000. HAMES INC. Balance Sheets December 31, 2020 and 2019 2020 2019 $ 19,000 78,000 103,000 $ 200,000 50,000 125,000 (65,000) $ 310,000 $ 20,000 72,000 99,000 $191,000 40,000 110,000 (60,000) $ 281,000 Assets Cash Accounts receivable Merchandise inventory Total current assets Land Plant and equipment Less: Accumulated depreciation Total assets Liabilities Short-term debt Accounts...
FORTEN COMPANY Comparative Balance Sheets December 31 Current Year Prior Year Assets Cash $ 72,400 $...
FORTEN COMPANY Comparative Balance Sheets December 31 Current Year Prior Year Assets Cash $ 72,400 $ 88,500 Accounts receivable 88,420 65,625 Inventory 298,156 266,800 Prepaid expenses 1,360 2,195 Total current assets 460,336 423,120 Equipment 142,500 123,000 Accum. depreciation—Equipment (44,125 ) (53,500 ) Total assets $ 558,711 $ 492,620 Liabilities and Equity Accounts payable $ 68,141 $ 137,175 Short-term notes payable 14,500 9,000 Total current liabilities 82,641 146,175 Long-term notes payable 57,500 63,750 Total liabilities 140,141 209,925 Equity Common stock, $5...
Presented here are the comparative balance sheets of Hames Inc. at December 31, 2020 and 2019....
Presented here are the comparative balance sheets of Hames Inc. at December 31, 2020 and 2019. Sales for the year ended December 31, 2020, totaled $630,000. HAMES INC. Balance Sheets December 31, 2020 and 2019 2020 2019 Assets Cash $ 20,000 $ 21,000 Accounts receivable 78,000 72,000 Merchandise inventory 103,000 99,000 Total current assets $ 201,000 $ 192,000 Land 50,000 40,000 Plant and equipment 125,000 110,000 Less: Accumulated depreciation (65,000 ) (60,000 ) Total assets $ 311,000 $ 282,000 Liabilities...
Presented here are the comparative balance sheets of Hames Inc. at December 31, 2020 and 2019....
 Presented here are the comparative balance sheets of Hames Inc. at December 31, 2020 and 2019. Sales for the year ended December 31, 2020, totaled $580,000. HAMES INC. Balance Sheets December 31, 2020 and 2019 2020 2019 $ 23,000 78,000 103,000 $ 204,000 50,000 125,000 (65,000) $ 314,000 $ 20,000 72,000 99,000 $191,000 40,000 110,000 (60,000) $ 281,000 Assets Cash Accounts receivable Merchandise inventory Total current assets Land Plant and equipment Less: Accumulated depreciation Total assets Liabilities Short-term debt Accounts...
Presented here are the comparative balance sheets of Hames Inc. at December 31, 2020 and 2019....
Presented here are the comparative balance sheets of Hames Inc. at December 31, 2020 and 2019. Sales for the year ended December 31, 2020, totaled $540,000. HAMES INC. Balance Sheets December 31, 2020 and 2019 2020 2019 Assets Cash $ 24,000 $ 21,000 Accounts receivable 78,000 72,000 Merchandise inventory 103,000 99,000 Total current assets $ 205,000 $ 192,000 Land 50,000 40,000 Plant and equipment 125,000 110,000 Less: Accumulated depreciation (65,000 ) (60,000 ) Total assets $ 315,000 $ 282,000 Liabilities...
Chech Presented here are the comparative balance sheets of Hames Inc. at December 31, 2020 and...
 Chech Presented here are the comparative balance sheets of Hames Inc. at December 31, 2020 and 2019. Sales for the year ended December 31, 2020, totaled $670,000. HAMES INC. Balance Sheets December 31, 2020 and 2019 2020 2019 $ 25,000 78,000 103,000 $ 206,000 50,000 125,000 (65,000) $ 316,000 $ 20,000 72,000 99,000 $191,000 40,000 110,000 (60,000) $ 281,000 Assets Cash Accounts receivable Merchandise inventory Total current assets Land Plant and equipment Less: Accumulated depreciation Total assets Liabilities Short-term debt...
Presented here are the comparative balance sheets of Hames Inc. at December 31, 2020 and 2019....
 Presented here are the comparative balance sheets of Hames Inc. at December 31, 2020 and 2019. Sales for the year ended December 31, 2020, totaled $690,000. HAMES INC. Balance Sheets December 31, 2020 and 2019 2020 2019 $ 19,000 78,000 103,000 $ 200,000 50,000 125,000 (65,000) $ 310,000 $ 20,000 72,000 99,000 $191,000 40,000 110,000 (60,000) $ 281,000 Assets Cash Accounts receivable Merchandise inventory Total current assets Land Plant and equipment Less: Accumulated depreciation Total assets Liabilities Short-term debt Accounts...
Presented here are the comparative balance sheets of Hames Inc. at December 31, 2020 and 2019....
Presented here are the comparative balance sheets of Hames Inc. at December 31, 2020 and 2019. Sales for the year ended December 31, 2020, totaled $690,000. HAMES INC. Balance Sheets December 31, 2020 and 2019 2020 2019 Assets Cash $ 20,000 $ 19,000 Accounts receivable 78,000 72,000 Merchandise inventory 103,000 99,000 Total current assets $ 201,000 $ 190,000 Land 50,000 40,000 Plant and equipment 125,000 110,000 Less: Accumulated depreciation (65,000 ) (60,000 ) Total assets $ 311,000 $ 280,000 Liabilities...
 Demonstration Problem Chapter 14 The Carpet Company's 2014 and 2015 balance sheets included the following items: December 31 2015 2014 Debits $ 4,000 9,000 18,000 15,000 $46,000 $10,500 8,000 21,000 18,000 $57,500 Cash Accounts receivable Merchandise inventory Equipment.... Totals.. Credits $ 4,000 7,000 1,000 1,500 27,000 6,000 11,000 $57,500 $3,000 5,000 2,000 Accumulated depreciation, equipment. Accounts payable Taxes payable.. Dividends payable.. Common stock, $10 par value Contributed capital in excess of par, common stock Retained earnings. 25,000 5,000 6,000 $46,000...
 Presented here are the comparative balance sheets of Hames Inc. at December 31, 2020 and 2019. Sales for the year ended December 31, 2020, totaled $650,000. HAMES INC. Balance Sheets December 31, 2020 and 2019 2020 2019 $ 19,000 78,000 103,000 $ 200,000 50,000 125,000 (65,000) $ 310,000 $ 20,000 72,000 99,000 $191,000 40,000 110,000 (60,000) $ 281,000 Assets Cash Accounts receivable Merchandise inventory Total current assets Land Plant and equipment Less: Accumulated depreciation Total assets Liabilities Short-term debt Accounts...
 Presented here are the comparative balance sheets of Hames Inc. at December 31, 2020 and 2019. Sales for the year ended December 31, 2020, totaled $580,000. HAMES INC. Balance Sheets December 31, 2020 and 2019 2020 2019 $ 23,000 78,000 103,000 $ 204,000 50,000 125,000 (65,000) $ 314,000 $ 20,000 72,000 99,000 $191,000 40,000 110,000 (60,000) $ 281,000 Assets Cash Accounts receivable Merchandise inventory Total current assets Land Plant and equipment Less: Accumulated depreciation Total assets Liabilities Short-term debt Accounts...
 Chech Presented here are the comparative balance sheets of Hames Inc. at December 31, 2020 and 2019. Sales for the year ended December 31, 2020, totaled $670,000. HAMES INC. Balance Sheets December 31, 2020 and 2019 2020 2019 $ 25,000 78,000 103,000 $ 206,000 50,000 125,000 (65,000) $ 316,000 $ 20,000 72,000 99,000 $191,000 40,000 110,000 (60,000) $ 281,000 Assets Cash Accounts receivable Merchandise inventory Total current assets Land Plant and equipment Less: Accumulated depreciation Total assets Liabilities Short-term debt...
 Presented here are the comparative balance sheets of Hames Inc. at December 31, 2020 and 2019. Sales for the year ended December 31, 2020, totaled $690,000. HAMES INC. Balance Sheets December 31, 2020 and 2019 2020 2019 $ 19,000 78,000 103,000 $ 200,000 50,000 125,000 (65,000) $ 310,000 $ 20,000 72,000 99,000 $191,000 40,000 110,000 (60,000) $ 281,000 Assets Cash Accounts receivable Merchandise inventory Total current assets Land Plant and equipment Less: Accumulated depreciation Total assets Liabilities Short-term debt Accounts...
Most questions answered within 3 hours.
-
Write a program to solve the Josephus problem, with the following
modification:
Sample Input:
./a.out n...
asked 10 minutes ago -
At the start of a CD it is spinning at a rate of 525 rpm
(revolutions...
asked 46 minutes ago -
4. Without doing any calculations, predict whether the observed
∆T would increase, decrease or remain the...
asked 2 hours ago -
Based on the range, which of the following sets of scores has
the greatest variability? 3,...
asked 3 hours ago -
Ripples in a pond travel at a velocity of 3 m/s with one peak
passing a...
asked 2 hours ago -
A man stands on the roof of a building of height 13.0 mm and
throws a...
asked 3 hours ago -
The extent to which assets are financed by borrowed funds and
other liabilities is indicated by:...
asked 4 hours ago -
Explain in detail
Germany is the fifth largest economy
explain what goods and services Germany specializes...
asked 4 hours ago -
The density of platinum is 21.45 g/mL. If a cube of platinum
with a mass of...
asked 4 hours ago -
Accounts Receivable
Sales
A/R Posting
Extended Sales Invoice
Packing Slip
Compare invoice to packing slip 2...
asked 4 hours ago -
Michaella, age 23, is a full-time law student and is claimed by
her parents as a...
asked 4 hours ago -
Why are polymers not typically casted into products?
asked 4 hours ago