
Homework Answers
Solution:
We can use an excel regression data analysis tool to answer the given question. The excel output is given below:

Add Answer to:
A sales manager collected the following data on annual sales for new customer accounts and the number of years of exper...
A sales manager collected the following data on annual sales for new customer accounts and the...
 A sales manager collected the following data on annual sales for new customer accounts and the number of years of experience for a sample of 10 salespersons. Years of Annual Sales Salesperson Experience ($1000s) 1 1 80 2 75 N 3 4 79 4 6 81 5 7 83 6 8 91 7 9 104 8 11 99 9 12 14 110 10 109 The data on y = annual sales ($1000s) for new customer accounts and 2 = number...
7. A sales manager collected the following data on annual sales for new customer accounts and...
 7. A sales manager collected the following data on annual sales for new customer accounts and the number of years of experience for a sample of 10 salespersons. Salesperson Years of Experience 1 Annual Sales ($1000s) 80 97 92 102 103 2 3 file ales 3 4 4 6 8 10 10 11 13 6 7 8 9 10 111 119 123 117 136 a. Develop a scatter diagram for these data with years of experience as the independent variable....
7. A sales manager collected the following data on annual sales for new customer accounts and...
 7. A sales manager collected the following data on annual sales for new customer accounts and the number of years of experience for a sample of 10 salespersons a. Develop a scatter diagram for these data with years of experience as the independent variable. b. Develop an estimated regression equation that can be used to predict annual sales given the years of experience. c. Use the estimated regression equation to predict annual sales for a salesperson with 9 years of...
A sales manager collected the following data on annual sales for new customer accounts and the...
 A sales manager collected the following data on annual sales for new customer accounts and the number of years of experience for a sample of 10 salespersons. Annual Sales Years of Salesperson Experience ($1000) 80 76 86 81 91 115 118 127 132 10 10 a. Compute the residuals and choose a residual plot for this problem (to 1 decimal)
1. A sales manager collected the following data on annual sales for new customer accounts and the number of years of experience for a sample of 10 salespersons.
 a. Based on the Excel output, what is the Pearson correlation coefficient for the years of experience and annual sales? Interpret this and write a conclusion about your answer. (5 points) b. Based on the Excel output, write the estimated simple linear regression equation to predict the annual sales from the years of experience. Interpret the values of your regression coefficients. (5 points) c. Based on the Excel output, what is the coefficient of determination? Interpret this and write a conclusion about...
A sales manager collected the following data on x = years of experience and y =...
 A sales manager collected the following data on x = years of experience and y = annual sales ($1,000s). The estimated regression equation for these data is y = 82 + 4x. Salesperson Years of Experience Annual Sales ($1,000s) 80 97 102 107 103 101 119 o 128 11 127 10 13 136 (a) Compute the residuals. (a) Compute the residuals. Years of Experience Annual Sales ($1,000s) Residuals 102 107 103 101 119 128 127 136 Construct a residual plot....
A sales manager collected the following data on x = years of experience and y =...
 A sales manager collected the following data on x = years of experience and y = annual sales ($1,000s). The estimated regression equation for these data is ý = 80 + 4x. Salesperson Years of Experience Annual Sales ($1,000s) 1 1 80 2 3 97 3 4 92 4 4 102 5 6 103 6 8 111 7 10 119 8 10 123 9 11 117 10 13 136 (a) Compute the residuals. Years of Experience Annual Sales ($1,000s) Residuals...
A sales manager collected the following data on x = years of experience and y =...
 A sales manager collected the following data on x = years of experience and y = annual sales ($1,000s). The estimated regression equation for these data is ý = 81 + 4x. Salesperson Years of Experience Annual Sales ($1,000s) 1 107 103 101 119 8 9 10 10 11 13 123 127 136 (a) Compute SST, SSR, and SSE. SST = SSR = SSE = (b) Compute the coefficient of determination 2. (Round your answer to three decimal places.) 12...
A sales manager collected the following data on x = years of experience and y =...
A sales manager collected the following data on x = years of experience and y = annual sales ($1,000s). The estimated regression equation for these data is ŷ = 80 + 4x. Salesperson Years of Experience Annual Sales ($1,000s) 1 1 80 2 3 97 3 4 97 4 4 102 5 6 103 6 8 101 7 10 119 8 10 118 9 11 127 10 13 136 (a) Compute SST, SSR, and SSE. SST= SSR= SSE= (b) Compute...
QUESTION 4 (3 points) A sales manager for an adve of contacts and the amount of the sales. To verify this believe, the following data was collected rtising agency believes there is a relationship...
 QUESTION 4 (3 points) A sales manager for an adve of contacts and the amount of the sales. To verify this believe, the following data was collected rtising agency believes there is a relationship between the number Number of Salesperson Contacts. Sales lin thousands 12 20 28 4 80 23 85 120 110 10 What is the 95% confidence interval for sales (in thousands) for someone who made 30 contacts? A. 51.5 to 55.8 B. 51.4 to 55.9 C. 46.7...
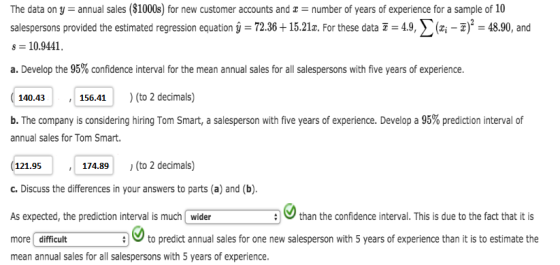
 A sales manager collected the following data on annual sales for new customer accounts and the number of years of experience for a sample of 10 salespersons. Years of Annual Sales Salesperson Experience ($1000s) 1 1 80 2 75 N 3 4 79 4 6 81 5 7 83 6 8 91 7 9 104 8 11 99 9 12 14 110 10 109 The data on y = annual sales ($1000s) for new customer accounts and 2 = number...
 7. A sales manager collected the following data on annual sales for new customer accounts and the number of years of experience for a sample of 10 salespersons. Salesperson Years of Experience 1 Annual Sales ($1000s) 80 97 92 102 103 2 3 file ales 3 4 4 6 8 10 10 11 13 6 7 8 9 10 111 119 123 117 136 a. Develop a scatter diagram for these data with years of experience as the independent variable....
 7. A sales manager collected the following data on annual sales for new customer accounts and the number of years of experience for a sample of 10 salespersons a. Develop a scatter diagram for these data with years of experience as the independent variable. b. Develop an estimated regression equation that can be used to predict annual sales given the years of experience. c. Use the estimated regression equation to predict annual sales for a salesperson with 9 years of...
 A sales manager collected the following data on annual sales for new customer accounts and the number of years of experience for a sample of 10 salespersons. Annual Sales Years of Salesperson Experience ($1000) 80 76 86 81 91 115 118 127 132 10 10 a. Compute the residuals and choose a residual plot for this problem (to 1 decimal)
 a. Based on the Excel output, what is the Pearson correlation coefficient for the years of experience and annual sales? Interpret this and write a conclusion about your answer. (5 points) b. Based on the Excel output, write the estimated simple linear regression equation to predict the annual sales from the years of experience. Interpret the values of your regression coefficients. (5 points) c. Based on the Excel output, what is the coefficient of determination? Interpret this and write a conclusion about...
 A sales manager collected the following data on x = years of experience and y = annual sales ($1,000s). The estimated regression equation for these data is y = 82 + 4x. Salesperson Years of Experience Annual Sales ($1,000s) 80 97 102 107 103 101 119 o 128 11 127 10 13 136 (a) Compute the residuals. (a) Compute the residuals. Years of Experience Annual Sales ($1,000s) Residuals 102 107 103 101 119 128 127 136 Construct a residual plot....
 A sales manager collected the following data on x = years of experience and y = annual sales ($1,000s). The estimated regression equation for these data is ý = 80 + 4x. Salesperson Years of Experience Annual Sales ($1,000s) 1 1 80 2 3 97 3 4 92 4 4 102 5 6 103 6 8 111 7 10 119 8 10 123 9 11 117 10 13 136 (a) Compute the residuals. Years of Experience Annual Sales ($1,000s) Residuals...
 A sales manager collected the following data on x = years of experience and y = annual sales ($1,000s). The estimated regression equation for these data is ý = 81 + 4x. Salesperson Years of Experience Annual Sales ($1,000s) 1 107 103 101 119 8 9 10 10 11 13 123 127 136 (a) Compute SST, SSR, and SSE. SST = SSR = SSE = (b) Compute the coefficient of determination 2. (Round your answer to three decimal places.) 12...
 QUESTION 4 (3 points) A sales manager for an adve of contacts and the amount of the sales. To verify this believe, the following data was collected rtising agency believes there is a relationship between the number Number of Salesperson Contacts. Sales lin thousands 12 20 28 4 80 23 85 120 110 10 What is the 95% confidence interval for sales (in thousands) for someone who made 30 contacts? A. 51.5 to 55.8 B. 51.4 to 55.9 C. 46.7...
Most questions answered within 3 hours.
-
(Expected rate of return and risk) Carter Inc. is evaluating a
security. Calculate the investment’s expected...
asked 2 hours ago -
What specific indicators can point to lack of progress for
African Americans in American society?
asked 3 hours ago -
1-The Electrons in a beam are moving at 2.7×10⁸ m/s in an
electric field of 15000...
asked 3 hours ago -
A gas tank is a vertical cylinder. It has a radius of 1m, a
height of...
asked 3 hours ago -
Accent Software faces the following conditions. All of these
support Accent’s use of a market-penetration pricing...
asked 4 hours ago -
A mathematically inclined friend emails you the following
instructions: "Meet me in the cafeteria the first...
asked 4 hours ago -
A monopoly sells in two countries . The demand curves in the two
countries are p1...
asked 5 hours ago -
A .15kg rubber ball is bounced off a wall. Before hitting the
wall, the ball moves...
asked 6 hours ago -
A manufacturing company preparing to build a new plant is
considering three potential locations for it....
asked 6 hours ago -
B. If compound Y has approximately the same values of solubility
in toluene as compound X,...
asked 7 hours ago -
Oscar Inc. has inventory in Japan valued at 39,051,000 Yen one
year ago. One year ago...
asked 7 hours ago -
If Canada suffered from "fundamental disequilibrium," and its
government choose not to devalue its currency, a...
asked 7 hours ago