The SAT and the ACT are the two major standardized tests that colleges use to evaluate candidates. Most students take ju...
The SAT and the ACT are the two major standardized tests that colleges use to evaluate candidates. Most students take just one of these tests. However, some students take both. The data data42.datgives the scores of 60 students who did this. How can we relate the two tests?
(a) Plot the data with SAT on the x axis and ACT on the
y axis. Describe the overall pattern and any unusual
observations.
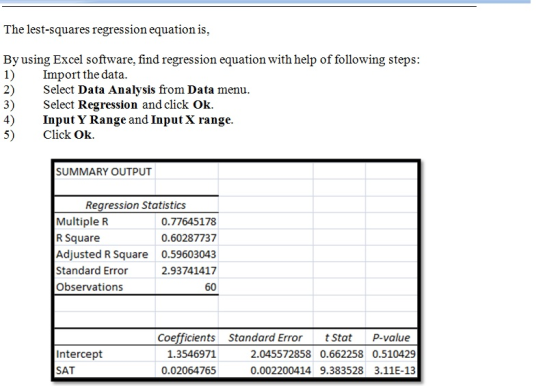
(b) Find the least-squares regression line and draw it on your
plot. Give the results of the significance test for the slope.
(Round your regression slope and intercept to three decimal places,
your test statistic to two decimal places, and your
P-value to four decimal places.)
| ACT = | + (SAT) |
| t = | |
| P = |
(c) What is the correlation between the two tests? (Round your
answer to three decimal places.)
Data set
obs     sat     act
1       708     15
2       1064    26
3       912     25
4       953     23
5       1251    28
6       648     12
7       1005    21
8       664     16
9       604     17
10      945     25
11      1034    21
12      895     16
13      935     19
14      909     24
15      938     17
16      777     21
17      703     14
18      1242    25
19      971     21
20      817     17
21      885     18
22      1138    23
23      909     17
24      788     21
25      1064    19
26      1170    26
27      806     15
28      923     20
29      1170    21
30      579     16
31      888     22
32      1207    24
33      871     22
34      1117    25
35      1070    17
36      767     17
37      969     22
38      1027    30
39      931     23
40      933     21
41      965     26
42      960     22
43      787     17
44      1002    20
45      1221    33
46      1042    24
47      897     22
48      1061    24
49      898     18
50      720     11
51      976     18
52      1066    25
53      931     18
54      593     12
55      735     16
56      544     10
57      871     17
58      875     21
59      921     22
60      559     15
Homework Answers


Add Answer to:
The SAT and the ACT are the two major standardized tests that colleges use to evaluate candidates. Most students take ju...
The SAT and the ACT are the two major standardized tests that colleges use to evaluate...
The SAT and the ACT are the two major standardized tests that colleges use to evaluate candidates. Most students take just one of these tests. However, some students take both. The data gives the scores of 60 students who did this. How can we relate the two tests? (a) Plot the data with SAT on the x axis and ACT on the y axis. Describe the overall pattern and any unusual observations. (b) Find the least-squares regression line and draw...
The SAT and the ACT are the two major standardized tests that colleges use to evaluate...
The SAT and the ACT are the two major standardized tests that colleges use to evaluate candidates. Most students take just one of these tests. However, some students take both. The data data432.dat gives the scores of 60 students who did this. How can we relate the two tests? (a) Plot the data with SAT on the x axis and ACT on the y axis. Describe the overall pattern and any unusual observations. (b) Find the least-squares regression line and...
The computer-science aptitude score, x, and the achievement score, y (measured by a comprehensive final), were...
The computer-science aptitude score, x, and the achievement score, y (measured by a comprehensive final), were measured for 20 students in a beginning computer-science course. The results were as follows. x 3 15 19 14 21 22 14 21 20 15 17 18 7 5 4 19 17 12 18 13 y 19 19 24 36 27 26 25 28 17 27 21 24 18 18 14 28 21 22 20 21 (a) Find the equation of the line of...
A college admissions office needs to compare scores of students that take the SAT with those...
 A college admissions office needs to compare scores of students that take the SAT with those who take the The college applicants who took the SAT, had a mean of 1020 and a standard deviation of 194. Those who The college applicants who took the ACT, had a mean 21 and a standard deviation of 5.4. D C Applicant SAT ACT X z-score = X 950 1320 19 28 284 2 132-1o2 17 Calculate the standardized z-score for Applicant A...
s. QUESTION 2 Use minitab Suppose a sample of 20 students were given a diagnostic test...
 s.
QUESTION 2 Use minitab Suppose a sample of 20 students were given a diagnostic test before studying a particular module and then again after completing the module. We want to find out if, in general, our teaching leads to improvements in students' knowledge/skills (i.e. test scores). We can use the results from our sample of students to draw conclusions about the impact of this module in general. 92.MPJ 1) check assumption (fort show your correct 3) find the t-value...
s.
QUESTION 2 Use minitab Suppose a sample of 20 students were given a diagnostic test before studying a particular module and then again after completing the module. We want to find out if, in general, our teaching leads to improvements in students' knowledge/skills (i.e. test scores). We can use the results from our sample of students to draw conclusions about the impact of this module in general. 92.MPJ 1) check assumption (fort show your correct 3) find the t-value...
14 24 18 23 21 18 16 14 23 17 15 13 19 23 24 14...
14 24 18 23 21 18 16 14 23 17 15 13 19 23 24 14 16 26 21 14 15 22 16 12 20 23 19 26 20 25 21 19 21 25 23 25 25 19 20 15 (a) Develop a frequency distribution using classes of 12-14, 15-17, 18-20, 21-23, and 24-26. Class Frequency 12-14 15-17 18-20 21-23 24-26 Total (b) Develop a relative frequency distribution and a percent frequency distribution using the classes in part (a). If...
(b) Develop a relative frequency distribution and a percent frequency distribution using the classes in part...
 (b) Develop a relative frequency distribution and a percent frequency distribution using the classes in part (a). If required, round your relative frequency answers to three decimal places and percent frequency answers to one decimal place. 12-14 15-17 18-20 21-23 24-26 Total Consider the following data: 14 19 23 19 16 15 20 20 21 25 24 18 17 23 26 18 16 15 24 21 16 19 21 23 20 23 14 13 14 16 12 26 19 25...
b) Develop a relative frequency distribution and a percent frequency distribution using the classes in part...
 b) Develop a relative
frequency distribution and a percent frequency distribution using
the classes in part (a). If required, round your relative frequency
answers to three decimal places and percent frequency answers to
one decimal place.
Consider the following data: 14 21 23 19 16 15 20 20 21 25 24 18 17 23 26 18 16 15 24 21 16 19 21 23 20 23 14 13 14 14 12 26 19 25 15 23 25 25 19 (a)...
b) Develop a relative
frequency distribution and a percent frequency distribution using
the classes in part (a). If required, round your relative frequency
answers to three decimal places and percent frequency answers to
one decimal place.
Consider the following data: 14 21 23 19 16 15 20 20 21 25 24 18 17 23 26 18 16 15 24 21 16 19 21 23 20 23 14 13 14 14 12 26 19 25 15 23 25 25 19 (a)...
A consumer advocate researches the length of life between two brands of refrigerators, Brand A and...
A consumer advocate researches the length of life between two brands of refrigerators, Brand A and Brand B. He collects data (measured in years) on the longevity of 40 refrigerators for Brand A and repeats the sampling for Brand B. These data are measured in years. (You may find it useful to reference the appropriate table: z table or t table) Brand A Brand B Brand A Brand B 15 24 25 23 25 24 13 19 18 23 16...
Consider the following data. 14 21 23 20 16 19 22 26 15 16 23 25...
Consider the following data. 14 21 23 20 16 19 22 26 15 16 23 25 24 20 15 20 19 20 21 13 17 17 18 23 26 21 22 15 20 18 25 24 15 23 25 19 21 24 21 19 (a) Develop a frequency distribution using classes of 12–14, 15–17, 18–20, 21–23, and 24–26. Class Frequency 12–14 15–17 18–20 21–23 24–26 Total (b) Develop a relative frequency distribution and a percent frequency distribution using the classes...
 A college admissions office needs to compare scores of students that take the SAT with those who take the The college applicants who took the SAT, had a mean of 1020 and a standard deviation of 194. Those who The college applicants who took the ACT, had a mean 21 and a standard deviation of 5.4. D C Applicant SAT ACT X z-score = X 950 1320 19 28 284 2 132-1o2 17 Calculate the standardized z-score for Applicant A...
 s.
QUESTION 2 Use minitab Suppose a sample of 20 students were given a diagnostic test before studying a particular module and then again after completing the module. We want to find out if, in general, our teaching leads to improvements in students' knowledge/skills (i.e. test scores). We can use the results from our sample of students to draw conclusions about the impact of this module in general. 92.MPJ 1) check assumption (fort show your correct 3) find the t-value...
s.
QUESTION 2 Use minitab Suppose a sample of 20 students were given a diagnostic test before studying a particular module and then again after completing the module. We want to find out if, in general, our teaching leads to improvements in students' knowledge/skills (i.e. test scores). We can use the results from our sample of students to draw conclusions about the impact of this module in general. 92.MPJ 1) check assumption (fort show your correct 3) find the t-value...
 (b) Develop a relative frequency distribution and a percent frequency distribution using the classes in part (a). If required, round your relative frequency answers to three decimal places and percent frequency answers to one decimal place. 12-14 15-17 18-20 21-23 24-26 Total Consider the following data: 14 19 23 19 16 15 20 20 21 25 24 18 17 23 26 18 16 15 24 21 16 19 21 23 20 23 14 13 14 16 12 26 19 25...
 b) Develop a relative
frequency distribution and a percent frequency distribution using
the classes in part (a). If required, round your relative frequency
answers to three decimal places and percent frequency answers to
one decimal place.
Consider the following data: 14 21 23 19 16 15 20 20 21 25 24 18 17 23 26 18 16 15 24 21 16 19 21 23 20 23 14 13 14 14 12 26 19 25 15 23 25 25 19 (a)...
b) Develop a relative
frequency distribution and a percent frequency distribution using
the classes in part (a). If required, round your relative frequency
answers to three decimal places and percent frequency answers to
one decimal place.
Consider the following data: 14 21 23 19 16 15 20 20 21 25 24 18 17 23 26 18 16 15 24 21 16 19 21 23 20 23 14 13 14 14 12 26 19 25 15 23 25 25 19 (a)...
Most questions answered within 3 hours.
-
Part 1- Inventory: You own a toy company and
you are producing wooden rocking horses. Assume...
asked 3 minutes ago -
What is aromaticity?
Identify aromatic molecules, especially those containing O, N,
S and B
asked 6 minutes ago -
A rubber solid circular wheel of uniform density spins about it
axis at rate of 60...
asked 18 minutes ago -
DNA evidence from an early human skeleton in Britain, shows that
early inhabitants of were blue...
asked 9 minutes ago -
Financial data for Joel de Paris, Inc., for last year
follow:
Joel de Paris, Inc.
Balance...
asked 17 minutes ago -
To practice Problem-Solving Strategy 19.1 Work in Ideal-gas
Processes.
A cylinder with initial volume V contains...
asked 26 minutes ago -
Depreciation for Partial Periods Bean Delivery Company purchased
a new delivery truck for $35,400 on April...
asked 30 minutes ago -
Q 5.23:
Jonathan has been doing calculations to determine a missing
component. So far he has...
asked 28 minutes ago -
Use indifference curve and the daily income-leisure choice model
to explain graphically the behavior of employees...
asked 48 minutes ago -
Record the following transactions of Fashion Park in a
general journal. Fashion Park must charge 8...
asked 49 minutes ago -
Chapter 08 Python Assignment: Question 1-5
Please I need help in my python course.
Question 1...
asked 53 minutes ago -
1.
In a study of the effectiveness of
a new pain killer,
4646
out of
821821...
asked 1 hour ago