
What is the income distribution of super shoppers? A supermarket super shopper is defined as a shopper for whom at least 70% of the items purchased were on sale or purchased with a coupon. In the following table, income units are in thousands of dollars, and each interval goes up to but does not include the given high value. The midpoints are given to the nearest thousand dollars. Income range 5-15 15-25 25-35 35-45 45-55 55 or more Midpoint x 10 20 30 40 50 60 Percent of super shoppers 21% 14% 22% 16% 19% 8%
(a) Using the income midpoints x and the percent of super shoppers, do we have a valid probability distribution? Explain.
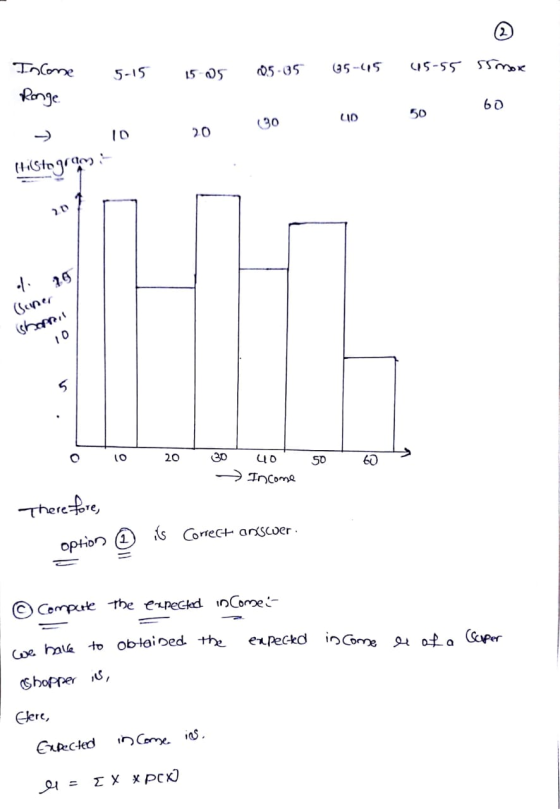
(b) Use a histogram to graph the probability distribution of part (a). (Select the correct graph.)
(c) Compute the expected income μ of a super shopper (in
thousands of dollars). (Enter a number. Round your answer to two
decimal places.)
μ = thousands of dollars
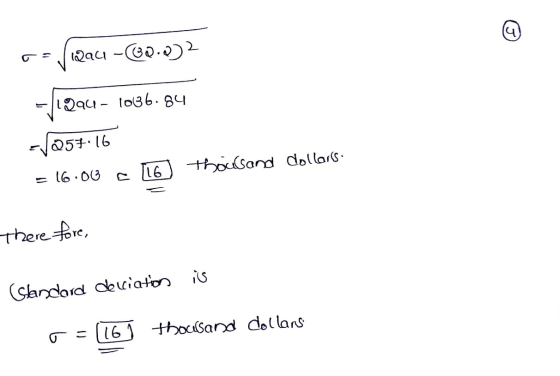
(d) Compute the standard deviation σ for the income of super
shoppers (in thousands of dollars). (Enter a number. Round your
answer to two decimal places.)
σ = thousands of dollars
Homework Answers

![ei= (lox 0.21] + DOVO.K(1) 46130 X 0.00] + C40*0.16] +C50* OLQI-+C600.08) Lºt - (+ 28-6.64 6. | 4 q5 + C: B] 21 - 09. 2) The](http://img.homeworklib.com/questions/3d5d9ed0-22f1-11ea-8ade-f3e2fbeee110.png?x-oss-process=image/resize,w_560)
Add Answer to:
What is the income distribution of super shoppers? A supermarket super shopper is defined as a shopper for whom at leas...
What is the income distribution of super shoppers? A supermarket super shopper is defined as a shopper for whom at least...
 What is the income distribution of super shoppers? A supermarket
super shopper is defined as a shopper for whom at least 70% of the
items purchased were on sale or purchased with a coupon. In the
following table, income units are in thousands of dollars, and each
interval goes up to but does not include the given high value. The
midpoints are given to the nearest thousand dollars. Income range
5-15, 15-25, 25-35, 35-45, 45-55, 55 or more. Midpoint x...
What is the income distribution of super shoppers? A supermarket
super shopper is defined as a shopper for whom at least 70% of the
items purchased were on sale or purchased with a coupon. In the
following table, income units are in thousands of dollars, and each
interval goes up to but does not include the given high value. The
midpoints are given to the nearest thousand dollars. Income range
5-15, 15-25, 25-35, 35-45, 45-55, 55 or more. Midpoint x...
What is the age distribution of promotion-sensitive shoppers? A supermarket super shopper is defined as a...
What is the age distribution of promotion-sensitive shoppers? A supermarket super shopper is defined as a shopper for whom at least 70% of the items purchased were on sale or purchased with a coupon. Age range, years 18-28 29-39 40-50 51-61 62 and over Midpoint x 23 34 45 56 67 Percent of super shoppers 9% 40% 26% 12% 13% For the 62-and-over group, use the midpoint 67 years. (a) Using the age midpoints x and the percentage of super...
What is the age distribution of promotion-sensitive shoppers? A supermarket super shopper is defined as a...
What is the age distribution of promotion-sensitive shoppers? A supermarket super shopper is defined as a shopper for whom at least 70% of the items purchased were on sale or purchased with a coupon. Age range, years 18-28 29-39 40-50 51-61 62 and over Midpoint x 23 34 45 56 67 Percent of super shoppers 8% 41% 19% 9% 23% For the 62-and-over group, use the midpoint 67 years. (a) Using the age midpoints x and the percentage of super...
What is the age distribution of promotion-sensitive shoppers?
 What is the age distribution of promotion-sensitive shoppers? A supermarket super shopper is defined as a shopper for whom at least 709% of the items purchased were on sale or purchased with a coupon.For the 62-and-over group, use the midpoint 67 years. (a) Using the age midpoints x and the percentage of super shoppers, do we have a valid probability distribution? Explain. No. The events are distinct and the probabilities sum to 1. Yes. The events are distinct and the probabilities sum to...
4. 6.55/12.5 points Previous Answers BBUnderStat 12 5.1.011. 2/10 Submissions Used My Notes Ask Your Teacher...
 4. 6.55/12.5 points Previous Answers BBUnderStat 12 5.1.011. 2/10 Submissions Used My Notes Ask Your Teacher What is the income distribution of super shoppers? A supermarket super shopper is defined as a shopper for whom at least 70% of the items purchased were on sale or purchased with a coupon. In the following table, income units are in thousands of dollars, and each interval goes up to but does not include the given high value. The midpoints are given to...
The estimated distribution (in millions) of the population by age in a certain country for the...
 The estimated distribution (in millions) of the population by age in a certain country for the year 2015 is shown in the pie chart. Make a frequency distribution for the data. Then use the table to estimate the sample mean and the sample standard deviation of the data set. Use 70 as the midpoint for "65 years and over." Under 4 years: 21.5 5-14 years: 39.9 15-19 years: 20.3 20-24 years: 22.3 25-34 years: 48.4 35-44 years: 37.8 45-64 years:...
Decide whether you can use the normal distribution to approximate the binomial distribution. If you can...
 Decide whether you can use the normal distribution to approximate the binomial distribution. If you can use the normal distribution to approximate the indicated probabilities and sketch their graphs. If you cannot explain why and use the binomial distribution to find the indicated probabilities A survey of adults found that 8% say their favorite sport is auto racing. You randomly select 600 adults and ask them to name their favorite sport. Complete parts (a) through (d). Determine whether a normal...
(Q28-Q33) We want to test if the annual household income in a small Midwestern city is...
(Q28-Q33) We want to test if the annual household income in a small Midwestern city is not normally distributed. We use the sample data on the fifth sheet labeled “Household Income” in the “INFO1020 Final Exam DataFile.xlsx” to conduct this goodness-of-fit test for normality. 28. If I plan to do a goodness of fit test with the normal distribution against all data. What is the correct alternative hypothesis for this question? 29:What test statistic is used in this test? 30....
The following data represent the number of people aged 25 to 64 years covered by health...
 The following data represent the number of people aged 25 to 64 years covered by health insurance (private or government) in 2018. Approximate Standard deviation for age. Age 25-34 35-44 45-54 55-64 Number millions) 21.2 32.8 32.7 22.7 144.70 (Type an integer or decimal rounded to two decimal places as needed.) 11.70 (Type an integer or decimal rounded to two decimal places as needed.) ts cess Librai Options Enter your answer in each of the answer boxes. ens Privacy Policy...
Listed below are amounts of court income and salaries paid to the town justices. All amounts...
 Listed below are amounts of court income and salaries paid to the town justices. All amounts are in thousands of dollars. Construct a scatterplot, find the value of the linear correlation coefficient r, and find the P-value using a = 0.05. Is there sufficient evidence to conclude that there is a linear correlation between court incomes and justice salaries? Based on the results, does it appear that justices might profit by levying larger fines? Court Income 64.0 406.0 1566.0 1130.0...
 What is the income distribution of super shoppers? A supermarket
super shopper is defined as a shopper for whom at least 70% of the
items purchased were on sale or purchased with a coupon. In the
following table, income units are in thousands of dollars, and each
interval goes up to but does not include the given high value. The
midpoints are given to the nearest thousand dollars. Income range
5-15, 15-25, 25-35, 35-45, 45-55, 55 or more. Midpoint x...
What is the income distribution of super shoppers? A supermarket
super shopper is defined as a shopper for whom at least 70% of the
items purchased were on sale or purchased with a coupon. In the
following table, income units are in thousands of dollars, and each
interval goes up to but does not include the given high value. The
midpoints are given to the nearest thousand dollars. Income range
5-15, 15-25, 25-35, 35-45, 45-55, 55 or more. Midpoint x...
 4. 6.55/12.5 points Previous Answers BBUnderStat 12 5.1.011. 2/10 Submissions Used My Notes Ask Your Teacher What is the income distribution of super shoppers? A supermarket super shopper is defined as a shopper for whom at least 70% of the items purchased were on sale or purchased with a coupon. In the following table, income units are in thousands of dollars, and each interval goes up to but does not include the given high value. The midpoints are given to...
 The estimated distribution (in millions) of the population by age in a certain country for the year 2015 is shown in the pie chart. Make a frequency distribution for the data. Then use the table to estimate the sample mean and the sample standard deviation of the data set. Use 70 as the midpoint for "65 years and over." Under 4 years: 21.5 5-14 years: 39.9 15-19 years: 20.3 20-24 years: 22.3 25-34 years: 48.4 35-44 years: 37.8 45-64 years:...
 Decide whether you can use the normal distribution to approximate the binomial distribution. If you can use the normal distribution to approximate the indicated probabilities and sketch their graphs. If you cannot explain why and use the binomial distribution to find the indicated probabilities A survey of adults found that 8% say their favorite sport is auto racing. You randomly select 600 adults and ask them to name their favorite sport. Complete parts (a) through (d). Determine whether a normal...
 The following data represent the number of people aged 25 to 64 years covered by health insurance (private or government) in 2018. Approximate Standard deviation for age. Age 25-34 35-44 45-54 55-64 Number millions) 21.2 32.8 32.7 22.7 144.70 (Type an integer or decimal rounded to two decimal places as needed.) 11.70 (Type an integer or decimal rounded to two decimal places as needed.) ts cess Librai Options Enter your answer in each of the answer boxes. ens Privacy Policy...
 Listed below are amounts of court income and salaries paid to the town justices. All amounts are in thousands of dollars. Construct a scatterplot, find the value of the linear correlation coefficient r, and find the P-value using a = 0.05. Is there sufficient evidence to conclude that there is a linear correlation between court incomes and justice salaries? Based on the results, does it appear that justices might profit by levying larger fines? Court Income 64.0 406.0 1566.0 1130.0...
Most questions answered within 3 hours.
-
This is C++ code for parking fee management program
#include <iostream>
#include <iomanip>
using namespace std;...
asked 1 minute ago -
The free energy change for the following reaction at 25 °C, when
[Sn2+] = 1.17 M...
asked 1 hour ago -
An MNE is this kind of industry when competition in one country
is essentially independent of...
asked 3 hours ago -
. For this set of questions, determine what
proportion of a normal distribution is located betweeneach...
asked 3 hours ago -
A college student is employed as a door-to-door newspaper
salesman. Historical data suggests that the student...
asked 4 hours ago -
MATLAB HW 11 problem using Switch Case and Input commands
Write a script file that calculates...
asked 4 hours ago -
Considering gravitational time dilation, calculate the time that
passes in Earth’s surface while 1 hour passes...
asked 5 hours ago -
Minitab Problem: Take the Lake Hume June rainfall data and find
use the processes outlined in...
asked 6 hours ago -
X Company is trying to decide whether to continue using old
equipment to make Product A...
asked 6 hours ago -
IN PYTHON ONLY !! Program 2: Re-work
program #5 (WeeklyHours) from the previous assignment such that...
asked 6 hours ago -
The average length of time between arrivals at a turnpike
toll-booth is 26 seconds. What is...
asked 8 hours ago -
(a) A piston at 6.1 atm contains a gas that occupies a volume of
3.5 L....
asked 9 hours ago