


ZACHARY COMPANY Statements of Income and Retained Earnings For the Years Ended December 31 Year 4 Year 3 Revenues Sales (net) $420,000 $400,000 Other revenues 11,800 8,800 431,800 408,800 Total revenues Expenses Cost of goods sold 210,000 160,000 Selling, general, and administrative 74,000 69,000 Interest expense 13,700 12,900 Income tax expense 118,000 117,000 415,700 358,900 Total expenses Net earnings (net income) Retained earnings, January 1 16,100 49,900 135,600 95,000 Less: Preferred stock dividends 4,500 4,500 Common stock dividends 4,800 4,800 $142,400 $135,600 Retained earnings, December 31
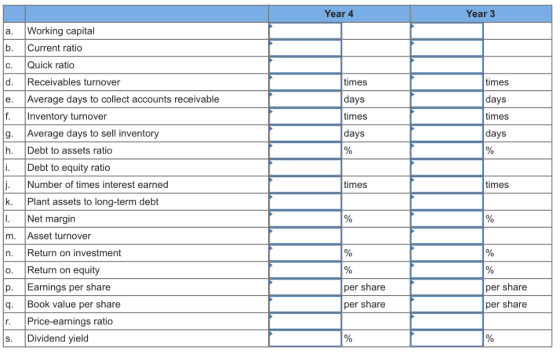
Required Calculate the following ratios for Year 4 and Year 3. Since Year 2 numbers are not presented do not use averages when calculating the ratios for Year 3. Instead, use the number presented on the Year 3 balance sheet a. Working capital b. Current ratio. (Round your answers to 2 decimal places.) c. Quick ratio. (Round your answers to 2 decimal places.) d. Receivables turnover (beginning receivables at January 1, Year 3, were $53,000). (Round your answers to 2 decimal places.) e. Average days to collect accounts receivable. (Round your intermediate calculations to 2 decimal places and your final answers to the nearest whole number.) f. Inventory turnover (beginning inventory at January 1, Year 3, was $159,000). (Round your answers to 2 decimal places.) g. Number of days to sell inventory. (Round your intermediate calculations to 2 decimal places and your final answers to the nearest whole number.) h. Debt-to-assets ratio. (Round your answers to the nearest whole percent.) i. Debt-to-equity ratio. (Round your answers to 2 decimal places.) j. Number of times interest was earned. (Round your answers to 2 decimal places.) k. Plant assets to long-term debt. (Round your answers to 2 decimal places.) I. Net margin. (Round your answers to 2 decimal places.) m. Turnover of assets. (Round your answers to 2 decimal places.) n. Return on investment. (Round your answers to 2 decimal places.) o. Return on equity. (Round your answers to 2 decimal places.) p. Earnings per share. (Round your answers to 2 decimal places.) q. Book value per share of common stock. (Round your answers to 2 decimal places.) r. Price-earnings ratio (market price per share: Year 3, $12.70; Year 4, $14.40). (Round your intermediate calculations and final answer to 2 decimal places.) s. Dividend yield on common stock. (Round your answers to 2 decimal places.)
Year 4 Year 3 Working capital a. b. Current ratio Quick ratio times d. Receivables turnover times days days Average days to collect accounts receivable e. times times f. Inventory turnover days days Average days to sell inventory % h. Debt to assets ratio % i. Debt to equity ratio Number of times interest earned times j. times k. Plant assets to long-term debt I. % Net margin m. Asset turnover Return on investm % n. % % Return on equity O Earnings per share per share per share Book value per share q. per share per share Price-earnings ratio r. Dividend yield % %
Homework Answers
Answer to a, b, c:

Answer to d and e:

Answer to f and g:

Answer to h, i and j:

Add Answer to:
Financial statements for Zachary Company follow. ZACHARY COMPANY Balance Sheets As of December 31 Year 4 Year 3 Asse...
Financial statements for Solomon Company follow. SOLOMON COMPANY Balance Sheets As of December 31 2019 2018...
 Financial statements for Solomon Company follow. SOLOMON COMPANY Balance Sheets As of December 31 2019 2018 $ 23,000 21,400 55,000 140,000 29,000 268,400 32,000 280,000 32,000 $612,400 $ 19,000 7,400 47,000 148,000 14,000 235,400 25,000 265,000 27,000 $552,400 Assets Current assets Cash Marketable securities Accounts receivable (net) Inventories Prepaid items Total current assets Investments Plant (net) Land Total assets Liabilities and Stockholders' Equity Liabilities Current liabilities Notes payable Accounts payable Salaries payable Total current liabilities Noncurrent liabilities Bonds payable Other...
Financial statements for Jordan Company follow JORDAN COMPANY Balance Sheets As of December 31 2019 2018...
 Financial statements for Jordan Company follow JORDAN COMPANY Balance Sheets As of December 31 2019 2018 Assets Current assets 20,500 20,900 50,000 135,000 29,000 255,400 27,000 270,000 27,000 $579,400 16,500 6,900 42,000 143,000 14,000 222,400 20,000 255,000 22,000 $519,400 Cash Marketable securities Accounts receivable (net) Inventories Prepaid items Total current assets Investments Plant (net) Land Total assets Liabilities and Stockholders' Equity Liabilities Current ї¡abiïities Notes payable Accounts payable Salaries payable 27,200 58,800 24,000 110,000 10,800 45,000 18,000 73,800 Total current...
Financial statements for Vernon Company follow. VERNON COMPANY Balance Sheets As of December 31 2019 2018...
 Financial statements for Vernon Company follow. VERNON COMPANY Balance Sheets As of December 31 2019 2018 $ 24,500 21,700 58,000 143,000 27,000 274,200 32,000 295,000 27,000 $628,200 $ 20,500 7,700 50,000 151,000 12,000 241,200 25,000 280,000 22,000 $568,200 Assets Current assets Cash Marketable securities Accounts receivable (net) Inventories Prepaid items Total current assets Investments Plant (net) Land Total assets Liabilities and Stockholders' Equity Liabilities Current liabilities Notes payable Accounts payable Salaries payable Total current liabilities Noncurrent liabilities Bonds payable Other...
Financial statements for Franklin Company follow. FRANKLIN COMPANY Balance Sheets As of December 31 2019 2018...
Financial statements for Franklin Company follow. FRANKLIN COMPANY Balance Sheets As of December 31 2019 2018 Assets Current assets Cash $ 19,500 $ 15,500 Marketable securities 20,700 6,700 Accounts receivable (net) 48,000 40,000 Inventories 133,000 141,000 Prepaid items 27,000 12,000 Total current assets 248,200 215,200 Investments 22,000 15,000 Plant (net) 290,000 275,000 Land 33,000 28,000 Total assets $ 593,200 $ 533,200 Liabilities and Stockholders’ Equity Liabilities Current liabilities Notes payable $ 31,200 $ 18,200 Accounts payable 133,800 120,000 Salaries payable...
Financial statements for Benson Company follow. BENSON COMPANY Balance Sheets As of December 31 2019 2018...
 Financial statements for Benson Company follow. BENSON COMPANY Balance Sheets As of December 31 2019 2018 Assets Current assets Cash Marketable securities Accounts receivable (net) Inventories 17,500 13,500 20,300 44,00036,090 129,000 137,0e0 28,00890 6,300 Prepaid items Total current assets 26,966 13,000 238,800 205,800 27,00020,880 270,000 255,0ee 29,888 Investments Plant (net) Land 24,800 Total assets $564,800 $504,800 Liabilities and Stockholders' Equity Liabilities Current liabilities Notes payable Accounts payable Salaries payable 17,200 8,500 88,800 75,00 24,00010 18,000 130,000 101,580 Total current liabilities...
Financial statements for Franklin Company follow. FRANKLIN COMPANY Balance Sheets As of December 31 2019 2018...
 Financial statements for Franklin Company follow. FRANKLIN COMPANY Balance Sheets As of December 31 2019 2018 $ 19,500 28,780 48,00 133,000 27,000 248,200 22,eee 290, eee 33,000 $593,200 $ 15,5ee 6,700 40,000 141,600 12,000 215,280 15,00 275,000 28,eee $533,280 Assets Current assets Cash Marketable securities Accounts receivable (net) Inventories Prepaid itens Total current assets Investments Plant (net) Land Total assets Liabilities and Stockholders' Equity Liabilities Current liabilities Notes payable Accounts payable Salaries payable Total current liabilities Noncurrent liabilities Bonds payable...
Financial statements for Vernon Company follow. VERNON COMPANY Balance Sheets As of December 31 2019 2018...
 Financial statements for Vernon Company follow. VERNON COMPANY Balance Sheets As of December 31 2019 2018 $ 24,500 21,700 58,000 143,000 27,000 274,200 32,000 295,000 27,000 $628,200 $ 20,500 7,700 50,000 151,000 12,000 241,200 25,000 280,000 22,000 $568,200 Assets Current assets Cash Marketable securities Accounts receivable (net) Inventories Prepaid items Total current assets Investments Plant (net) Land Total assets Liabilities and Stockholders' Equity Liabilities Current liabilities Notes payable Accounts payable Salaries payable Total current liabilities Noncurrent liabilities Bonds payable Other...
Financial statements for Thornton Company follow. THORNTON COMPANY Balance Sheets As of December 31 2019 2018...
Financial statements for Thornton Company follow. THORNTON COMPANY Balance Sheets As of December 31 2019 2018 Assets Current assets Cash $ 24,000 $ 20,000 Marketable securities 21,600 7,600 Accounts receivable (net) 57,000 49,000 Inventories 142,000 150,000 Prepaid items 26,000 11,000 Total current assets 270,600 237,600 Investments 22,000 15,000 Plant (net) 290,000 275,000 Land 29,000 24,000 Total assets $ 611,600 $ 551,600 Liabilities and Stockholders’ Equity Liabilities Current liabilities Notes payable $ 40,000 $ 17,300 Accounts payable 113,800 100,000 Salaries payable...
can someone help me Financial statements for Fanning Company follow FANNING COMPANY Balance Sheets As of...
 can someone help me
Financial statements for Fanning Company follow FANNING COMPANY Balance Sheets As of December 31 2019 2018 25.000 241,000 208.000 280,000 31,000 $584 000 26.000 $524 000 $ Current assets Cash Marketable securities Accounts receivable net) Inventories Prepaid items Total current assets Investments Plant (net) Land Total assets Liabilities and Stockholders' Equity Liabilities Current liable Notes payable Accounts payable Salaries payable Total current a s Noncurrenties Bonds payable Other Total noncurrent abilities Total liabilities Stockholders' equity Preferred...
can someone help me
Financial statements for Fanning Company follow FANNING COMPANY Balance Sheets As of December 31 2019 2018 25.000 241,000 208.000 280,000 31,000 $584 000 26.000 $524 000 $ Current assets Cash Marketable securities Accounts receivable net) Inventories Prepaid items Total current assets Investments Plant (net) Land Total assets Liabilities and Stockholders' Equity Liabilities Current liable Notes payable Accounts payable Salaries payable Total current a s Noncurrenties Bonds payable Other Total noncurrent abilities Total liabilities Stockholders' equity Preferred...
 Financial statements for Solomon Company follow. SOLOMON COMPANY Balance Sheets As of December 31 2019 2018 $ 23,000 21,400 55,000 140,000 29,000 268,400 32,000 280,000 32,000 $612,400 $ 19,000 7,400 47,000 148,000 14,000 235,400 25,000 265,000 27,000 $552,400 Assets Current assets Cash Marketable securities Accounts receivable (net) Inventories Prepaid items Total current assets Investments Plant (net) Land Total assets Liabilities and Stockholders' Equity Liabilities Current liabilities Notes payable Accounts payable Salaries payable Total current liabilities Noncurrent liabilities Bonds payable Other...
 Financial statements for Jordan Company follow JORDAN COMPANY Balance Sheets As of December 31 2019 2018 Assets Current assets 20,500 20,900 50,000 135,000 29,000 255,400 27,000 270,000 27,000 $579,400 16,500 6,900 42,000 143,000 14,000 222,400 20,000 255,000 22,000 $519,400 Cash Marketable securities Accounts receivable (net) Inventories Prepaid items Total current assets Investments Plant (net) Land Total assets Liabilities and Stockholders' Equity Liabilities Current ї¡abiïities Notes payable Accounts payable Salaries payable 27,200 58,800 24,000 110,000 10,800 45,000 18,000 73,800 Total current...
 Financial statements for Vernon Company follow. VERNON COMPANY Balance Sheets As of December 31 2019 2018 $ 24,500 21,700 58,000 143,000 27,000 274,200 32,000 295,000 27,000 $628,200 $ 20,500 7,700 50,000 151,000 12,000 241,200 25,000 280,000 22,000 $568,200 Assets Current assets Cash Marketable securities Accounts receivable (net) Inventories Prepaid items Total current assets Investments Plant (net) Land Total assets Liabilities and Stockholders' Equity Liabilities Current liabilities Notes payable Accounts payable Salaries payable Total current liabilities Noncurrent liabilities Bonds payable Other...
 Financial statements for Benson Company follow. BENSON COMPANY Balance Sheets As of December 31 2019 2018 Assets Current assets Cash Marketable securities Accounts receivable (net) Inventories 17,500 13,500 20,300 44,00036,090 129,000 137,0e0 28,00890 6,300 Prepaid items Total current assets 26,966 13,000 238,800 205,800 27,00020,880 270,000 255,0ee 29,888 Investments Plant (net) Land 24,800 Total assets $564,800 $504,800 Liabilities and Stockholders' Equity Liabilities Current liabilities Notes payable Accounts payable Salaries payable 17,200 8,500 88,800 75,00 24,00010 18,000 130,000 101,580 Total current liabilities...
 Financial statements for Franklin Company follow. FRANKLIN COMPANY Balance Sheets As of December 31 2019 2018 $ 19,500 28,780 48,00 133,000 27,000 248,200 22,eee 290, eee 33,000 $593,200 $ 15,5ee 6,700 40,000 141,600 12,000 215,280 15,00 275,000 28,eee $533,280 Assets Current assets Cash Marketable securities Accounts receivable (net) Inventories Prepaid itens Total current assets Investments Plant (net) Land Total assets Liabilities and Stockholders' Equity Liabilities Current liabilities Notes payable Accounts payable Salaries payable Total current liabilities Noncurrent liabilities Bonds payable...
 Financial statements for Vernon Company follow. VERNON COMPANY Balance Sheets As of December 31 2019 2018 $ 24,500 21,700 58,000 143,000 27,000 274,200 32,000 295,000 27,000 $628,200 $ 20,500 7,700 50,000 151,000 12,000 241,200 25,000 280,000 22,000 $568,200 Assets Current assets Cash Marketable securities Accounts receivable (net) Inventories Prepaid items Total current assets Investments Plant (net) Land Total assets Liabilities and Stockholders' Equity Liabilities Current liabilities Notes payable Accounts payable Salaries payable Total current liabilities Noncurrent liabilities Bonds payable Other...
 Financial statements for Vernon Company follow. VERNON COMPANY Balance Sheets As of December 31 2019 2018 $ 24,500 21,700 58,000 143,000 27,000 274,200 32,000 295,000 27,000 $628,200 $ 20,500 7,700 50,000 151,000 12,000 241,200 25,000 280,000 22,000 $568,200 Assets Current assets Cash Marketable securities Accounts receivable (net) Inventories Prepaid items Total current assets Investments Plant (net) Land Total assets Liabilities and Stockholders' Equity Liabilities Current liabilities Notes payable Accounts payable Salaries payable Total current liabilities Noncurrent liabilities Bonds payable Other...
 can someone help me
Financial statements for Fanning Company follow FANNING COMPANY Balance Sheets As of December 31 2019 2018 25.000 241,000 208.000 280,000 31,000 $584 000 26.000 $524 000 $ Current assets Cash Marketable securities Accounts receivable net) Inventories Prepaid items Total current assets Investments Plant (net) Land Total assets Liabilities and Stockholders' Equity Liabilities Current liable Notes payable Accounts payable Salaries payable Total current a s Noncurrenties Bonds payable Other Total noncurrent abilities Total liabilities Stockholders' equity Preferred...
can someone help me
Financial statements for Fanning Company follow FANNING COMPANY Balance Sheets As of December 31 2019 2018 25.000 241,000 208.000 280,000 31,000 $584 000 26.000 $524 000 $ Current assets Cash Marketable securities Accounts receivable net) Inventories Prepaid items Total current assets Investments Plant (net) Land Total assets Liabilities and Stockholders' Equity Liabilities Current liable Notes payable Accounts payable Salaries payable Total current a s Noncurrenties Bonds payable Other Total noncurrent abilities Total liabilities Stockholders' equity Preferred...
Most questions answered within 3 hours.
-
If a lossless transformer has 1000 turns for a primary winding
and 100 turns for the...
asked 51 seconds ago -
Write the net ionic equation for the precipitation reaction that
occurs when aqueous solutions of potassium...
asked 9 minutes ago -
it
should be written in c++
Your program should take numbers from the user until the...
asked 15 minutes ago -
Buses are powered by chemical reactions. Define matter and the
four states of matter. What is...
asked 33 minutes ago -
Use conservation of energy to find the velocity of a free point
charge q1 at 22cm...
asked 40 minutes ago -
First, describe policies promoted by governments of the
political right to address economic globalization. Second, describe...
asked 57 minutes ago -
M2-9 Completing T-Accounts LO2-4
Following are the transactions of Dennen, Inc., for the month of
January....
asked 57 minutes ago -
Write a program using python that reads from values from a text
file and plots them...
asked 58 minutes ago -
Look up the density of
the metal of the object used in parts A and B...
asked 58 minutes ago -
Discuss strategic considerations that Amazon and NYC politicians
had. Analyze why the deal between Amazon and...
asked 1 hour ago -
A combustion reaction is describes as a carbon source reacting
with oxygen and producing carbon dioxide...
asked 1 hour ago -
Buckminsterfullerence is a recently allotrope of carbon in which
carbon atoms form molecules of formula C_60,...
asked 1 hour ago