 Box 1 Options: (Price takers)
(Monopolistically Competitive firms) (price makers)
Box 1 Options: (Price takers)
(Monopolistically Competitive firms) (price makers)
Box 2 Options: (Supply) (Demand) (Average total cost)
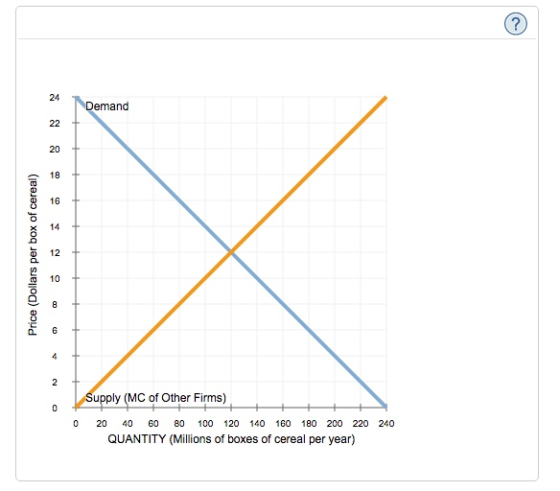

24 Demand 22 20 18 16 14 12 10 8 6 4 Supply (MC of Other Firms) 0 0 20 40 60 80 100 120 140 160 180 200 220 240 QUANTITY (Millions of boxes of cereal per year) Price (Dollars per box cereal)
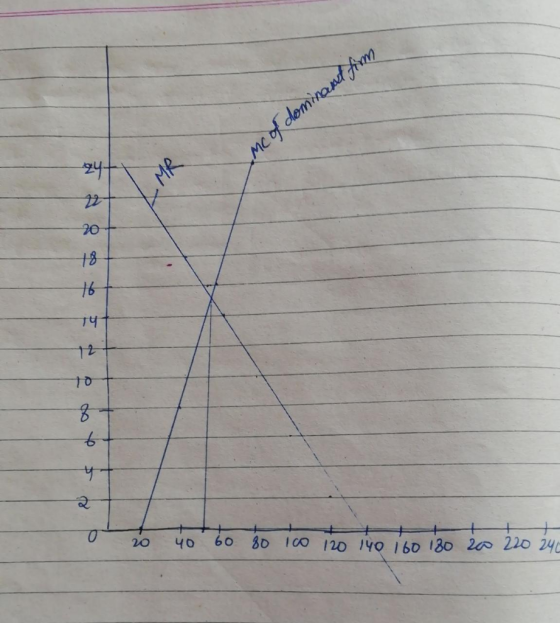
24 22 DF Demand 20 18 16 Marginal Revenue 14 12 10 8 6 2 MC of Dominant Firm 0 20 40 60 80 100 120 140 160 180 200 220 240 QUANTITY (Millions of boxes of cereal per year) This graph also shows the dominant firm's marginal cost curve. Given that cost curve, as well as the demand and marginal revenue curves you derived, the price of a box of cereal will be under the price leadership model. Price (Dollars per box of cereal)
Homework Answers
Under the theory of oligopoly, all other firms than the dominant firm act as PRICE TAKERS, they take the price set by dominant firm as given and select their quantity at that price.
Therefore, the horizontal sum of their marginal cost curves is their SUPPLY curve.
The price of box of cereal will be determined where the MR curve is equal to the MC curve of the dominant firm. This happens at quantity 50. At this quantity,the price would be at 19. (As happens in the monopolistic market, equilibrium price is determined where equilibrium quantity touches the AR/demand curve). Thus, price is 19.
The MR is derived below, the diagram is hand drawn and thus not perfectly scaled.

Add Answer to:
Box 1 Options: (Price takers) (Monopolistically Competitive firms) (price makers) Box 2 Options: (Supply) (Demand) (Aver...
Graphs NOT required! The demand and supply curves for potato chips are: Price Quantity demanded (cents...
 Graphs NOT required! The demand and supply curves for potato chips are: Price Quantity demanded (cents per (millions of bags per bag) week) 180 30 160 140 120 100 20 40 Quantity supplied (millions of bags per week) 160 180 200 220 240 260 280 80 60 a What are the equilibrium price and quantity of chips? (2) b. Calculate the price elasticity of demand from 40 to 80 cents per bag (Show your work). Is demand elastic or inelastic...
2. The demand curve facing a competitive firm Falero is one of more than a hundred...
 2. The demand curve facing a competitive firm Falero is one of more than a hundred competitive forms in New York City that produce small cardboard boxes for moving. The following graph shows the daily market demand and supply curves. Demand Supply PRICE (Dollars per small box) QUANTITY (Millions of small boxes) Home On the following graph, use the green line (triangle symbol) to plot the demand curve for Falero's small cardboard boxes. rses INLIMITED wse Catalog ner Offers Options...
2. (15 points). The demand function for an oligopolistic market is given by the equation, Q 180-4P, where Q is quantity demanded and P is price. The industry has one dominant firm whose margina...
 2. (15 points). The demand function for an oligopolistic market is given by the equation, Q 180-4P, where Q is quantity demanded and P is price. The industry has one dominant firm whose marginal cost function is: MC 12+1Qp, and many small firms, with a total supply function: Qs 20+ P. (a) Derive the demand equation for the dominant oligopoly firm. (b) Determine the dominant oligopoly firm's profit-maximizing out- put and price. (c) Determine the total output of the small...
2. The demand curve facing a competitive firm The following graph shows the daily market for...
 2. The demand curve facing a competitive firm The following graph shows the daily market for small cardboard boxes in Detroit. Suppose that Talero is one of more than a hundred competitive firms in Detroit that produce such cardboard boxes. Based on the preceding graph showing the daily market demand and supply curves, the price Talero must take as given is _______ . Fill in the price and the total, marginal, and average revenue Talero earns when it produces 0, 1, 2, or 3...
The demand curve facing a dominant firm in the price leadership model is derived by subtracting...
 The demand curve facing a dominant firm in the price leadership model is derived by subtracting the: a. dominant firm's marginal cost curve from the industry's supply curve b. amount supplied by the smaller firms from market supply c. amount demanded by customers of the smaller firms from market supply d. amount supplied by the smaller firms from market demand e. dominant firm's average cost curve from the industry's supply curve
In a monopolistic competitive market for blood pressure monitor, suppose the market demand function for the monitor is P=160 – 3Q, where P is the price for monitor, Q and the quantity of monitor dema...
In a monopolistic competitive market for blood pressure monitor, suppose the market demand function for the monitor is P=160 – 3Q, where P is the price for monitor, Q and the quantity of monitor demanded. Marginal cost of producing it is MC: P = 20 + Q, where P is the price of the monitor and Q is the quantity of the monitor sold. Use the Twice as Steep Rule, form the marginal revenue function. What are the price and...
The figure shows the demand and cost curves for a monopolistically competitive firm in the long...
 The figure shows the demand and cost curves for a monopolistically competitive firm in the long run. The maximum economic profit this firm can earn equal equals O A. $160. B. $80. OC. $0. OD. $120. MC ATC Price and costs (dollars per unit) MR 4 8 12 16 20 24 Quantity (units per day)
A monopolistically competitive firm faces the following demand curve for its product: 6 Price ($) Quantity...
 A monopolistically competitive
firm faces the following demand curve for its product: 6 Price ($)
Quantity 10 2 9 4 8 6 7 8 5 12 4 14 3 16 2 18 1 20 10 Refer to the
Table. The firm has total fixed costs of $20 and a constant
marginal cost of $5 per unit. What will the firm do? a) It will
produce 2 units; firms will exit the market in the long run. b) It
will produce...
A monopolistically competitive
firm faces the following demand curve for its product: 6 Price ($)
Quantity 10 2 9 4 8 6 7 8 5 12 4 14 3 16 2 18 1 20 10 Refer to the
Table. The firm has total fixed costs of $20 and a constant
marginal cost of $5 per unit. What will the firm do? a) It will
produce 2 units; firms will exit the market in the long run. b) It
will produce...
Vesoro is one of more than a hundred competitive firms in Denver that produce large cardboard boxes for moving.
 1. The demand curve facing a competitive firm Vesoro is one of more than a hundred competitive firms in Denver that produce large cardboard boxes for moving. The following graph shows the daily market demand and supply curves. On the following graph, use the green line (triangle symbol) to plot the demand curve for Vesoro's large cardboard boxes. Fill in the price and the total, marginal, and average revenue Vesoro earns when it produces 0, 1, 2, or 3 boxes each day. The demand...
12. Consider an industry with a dominant firm and a competitive fringe. The market demand for...
 12. Consider an industry with a dominant firm and a competitive fringe. The market demand for the product is given by P - 100 - 20 where P is the market price for the product, and Q is the total amount sold in the industry. The dominate firm's marginal cost is given by the equation MC-80, and the supply curve for the competitive fringe is Q-P/2. Use this information to find the Residual Demand curve faced by the dominant firm;...
 Graphs NOT required! The demand and supply curves for potato chips are: Price Quantity demanded (cents per (millions of bags per bag) week) 180 30 160 140 120 100 20 40 Quantity supplied (millions of bags per week) 160 180 200 220 240 260 280 80 60 a What are the equilibrium price and quantity of chips? (2) b. Calculate the price elasticity of demand from 40 to 80 cents per bag (Show your work). Is demand elastic or inelastic...
 2. The demand curve facing a competitive firm Falero is one of more than a hundred competitive forms in New York City that produce small cardboard boxes for moving. The following graph shows the daily market demand and supply curves. Demand Supply PRICE (Dollars per small box) QUANTITY (Millions of small boxes) Home On the following graph, use the green line (triangle symbol) to plot the demand curve for Falero's small cardboard boxes. rses INLIMITED wse Catalog ner Offers Options...
 2. (15 points). The demand function for an oligopolistic market is given by the equation, Q 180-4P, where Q is quantity demanded and P is price. The industry has one dominant firm whose marginal cost function is: MC 12+1Qp, and many small firms, with a total supply function: Qs 20+ P. (a) Derive the demand equation for the dominant oligopoly firm. (b) Determine the dominant oligopoly firm's profit-maximizing out- put and price. (c) Determine the total output of the small...
 The demand curve facing a dominant firm in the price leadership model is derived by subtracting the: a. dominant firm's marginal cost curve from the industry's supply curve b. amount supplied by the smaller firms from market supply c. amount demanded by customers of the smaller firms from market supply d. amount supplied by the smaller firms from market demand e. dominant firm's average cost curve from the industry's supply curve
 The figure shows the demand and cost curves for a monopolistically competitive firm in the long run. The maximum economic profit this firm can earn equal equals O A. $160. B. $80. OC. $0. OD. $120. MC ATC Price and costs (dollars per unit) MR 4 8 12 16 20 24 Quantity (units per day)
 A monopolistically competitive
firm faces the following demand curve for its product: 6 Price ($)
Quantity 10 2 9 4 8 6 7 8 5 12 4 14 3 16 2 18 1 20 10 Refer to the
Table. The firm has total fixed costs of $20 and a constant
marginal cost of $5 per unit. What will the firm do? a) It will
produce 2 units; firms will exit the market in the long run. b) It
will produce...
A monopolistically competitive
firm faces the following demand curve for its product: 6 Price ($)
Quantity 10 2 9 4 8 6 7 8 5 12 4 14 3 16 2 18 1 20 10 Refer to the
Table. The firm has total fixed costs of $20 and a constant
marginal cost of $5 per unit. What will the firm do? a) It will
produce 2 units; firms will exit the market in the long run. b) It
will produce...
 12. Consider an industry with a dominant firm and a competitive fringe. The market demand for the product is given by P - 100 - 20 where P is the market price for the product, and Q is the total amount sold in the industry. The dominate firm's marginal cost is given by the equation MC-80, and the supply curve for the competitive fringe is Q-P/2. Use this information to find the Residual Demand curve faced by the dominant firm;...
Most questions answered within 3 hours.
-
a 1.2-cm-diameter solenoid passing through the center of a
7.0-cm-diameter loop. The magnetic field inside the...
asked 1 minute ago -
One of the difficulties in geolocational profiling plant-derived
drugs is obtaining reliable standards. Elaborate on this...
asked 22 minutes ago -
An animal whose limb temperature is colder compared to the core
is displaying....
d. counter current...
asked 22 minutes ago -
Find the expected value E(X), the variance Var(X) and the
standard deviation σ(X) for each of...
asked 1 hour ago -
home / study / science / physics / physics questions and answers
/ 2. an object...
asked 45 minutes ago -
What do you think every computer science department must teach,
concerning the fact that technology rapidly...
asked 42 minutes ago -
An open cart is travelling at constant speed on a level surface.
A load of coal...
asked 48 minutes ago -
A ski-jumper leaves the ski track moving in the horizontal
direction with a speed of 25.0...
asked 57 minutes ago -
A commercial lubricant, Dubdeefordy, has K = SN/SM = 13.1 for
immiscible solvent M and N....
asked 1 hour ago -
Are there any potential drawback to the job-crafting approach?
If so, how can they be minimized?
asked 57 minutes ago -
12. To accommodate growth until a new version of IP could be
standardized and adopted, a...
asked 1 hour ago -
Create a separation scheme flow chart/diagram to isolate methyl
salicylate from a product mixture containing the...
asked 1 hour ago