
 Please solve and
explain steps thanks
Please solve and
explain steps thanks
0.25 0.25 0.20 0.20 UCL UCL 0.15 0.15 0.10 0.10 0.05 LCL 0.05 F LCL 0.00 Day 5 10 15 20 25 30 LI Day -0.05 15 25 30 10 20 0.00 p p 0.25 0.25 0.20 0.20 UCL 0.15 0.15 UCL 0.10 0.10 0.05F LCL 0.05 LCL Day 0.00 15 30 10 20 25 0.00 15 10 20 25 30 Comment on the chart. The value of s on the 5th day lies below the LCL, so an out-of-control signal is generated The value of s on the 5th day lies above the UCL, so an out-of-control signal is generated. All points are between these limits, so the process appears to be out of control Most points are between these limits, so the process appears to be in control with respect to variability. All points are between these limits, so the process appears to be in control
Homework Answers
Results:
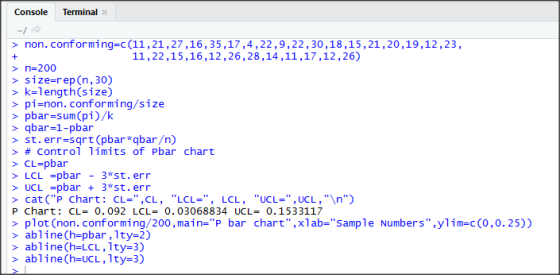
P-bar = CL= 0.092
LCL= 0.03068834
UCL= 0.1533117
since
R-code:

Correct Graph : Option (A)
Correct answer: Option (B) The value of Sbar on the 5th day lies above the UCL, so an out-of -control is generated
Add Answer to:
Please solve and explain steps thanks A sample of 200 ROM computer chips was selected on each of 30 consecutive d...
A sample of 200 ROM computer chips was selected on each of 30 consecutive days, and the number of nonconforming chips on...
A sample of 200 ROM computer chips was selected on each of 30 consecutive days, and the number of nonconforming chips on each day was as follows: 10, 21, 26, 18, 38, 20, 5, 23, 11, 22, 28, 12, 14, 22, 20, 19, 16, 25, 10, 17, 14, 17, 15, 22, 29, 15, 9, 19, 16, 25 Calculate pbar = LCL = UCL =
A manufacturer of dustless chalk instituted a quality control program to monitor chalk density. The sample standard dev...
 A manufacturer of dustless chalk instituted a quality control program to monitor chalk density. The sample standard deviations of densities for 24 different subgroups, each consisting of n 8 chalk specimens, were as follows: This data has been coded so that you may copy and paste it into R with the name k.sdevs. k.sdevs c(0.202, 0.315, 0.097, 0.182, 0.229, 0.215, 0.320, 0.288, 0.146, 0.208, 0.050, 0.145, 0.269, 0.350, 0.158. 0.215, 0.386, 0.187, 0.151, 0.231, 0.275, 0.117, 0.091, 0.059) mean(k.sdevs) #Construct...
f dustless chalk Instituted a quality control program A manufacturer o monitor chalk density. The sample standard devia...
 f dustless chalk Instituted a quality control program A manufacturer o monitor chalk density. The sample standard deviations of densities for 24 different subgroups, each consisting of n 8 chalk specimens, were as follows: This data has been coded so that you may copy and paste it into R with the name k.sdevs. k.sdevs c(0.207, 0.313, 0.097, 0.186, 0.233, 0.209, 0.319, 0.290, 0.143 0.212, 0.054, 0.146, 0.274, 0.348, 0.161, 0.216, 0.090, 0.056) 0.152, 0.231, 0.274, 0.121, 0.385, 0.188. mean(k.sdevs) #...
Solve Part 2 First Name Last Name Please put your name on this test and every...
 Solve Part 2
First Name Last Name Please put your name on this test and every page that you submit. Please answer the questions and solve the problem in the proper order [1, 2, 3...] 20 points each. tely precisely, and completely as possible 1. Explain Deming's Funnel Experiment. What did he use it for? 2. Differentiate between Pareto Chart and Cause-and-Effect Diagram. Which one should be used first? 3. Explain "The Central Limit Theorem." Why is it so important...
Solve Part 2
First Name Last Name Please put your name on this test and every page that you submit. Please answer the questions and solve the problem in the proper order [1, 2, 3...] 20 points each. tely precisely, and completely as possible 1. Explain Deming's Funnel Experiment. What did he use it for? 2. Differentiate between Pareto Chart and Cause-and-Effect Diagram. Which one should be used first? 3. Explain "The Central Limit Theorem." Why is it so important...
Please use R program to solve with explanation. Enterprise Industries produces Fresh, a liquid landry detergent....
 Please use R program to solve with explanation.
Enterprise Industries produces Fresh, a liquid landry detergent.
The company wishes to study the relationship between price and
demand for the large size bottle of Fresh in its sales regions. The
company has gathered data (see Table) concerning demand for Fresh
in 30 sales regions of equal sales potential.
i = 1,2,.,30 ythe demand for the large size bottle of Fresh (in hundreds of thousand) in sales region i Xithe price (in...
Please use R program to solve with explanation.
Enterprise Industries produces Fresh, a liquid landry detergent.
The company wishes to study the relationship between price and
demand for the large size bottle of Fresh in its sales regions. The
company has gathered data (see Table) concerning demand for Fresh
in 30 sales regions of equal sales potential.
i = 1,2,.,30 ythe demand for the large size bottle of Fresh (in hundreds of thousand) in sales region i Xithe price (in...
2.56 A researcher from a search engine company runs Internet searches and times how long each...
 2.56 A researcher from a search engine company runs Internet searches and times how long each one takes. She found that 17 searches took 0.01 to 0.05 seconds; 57 took 0.06 to 0.10 seconds; 134 took 0.11 to 0.15 sec- onds; 146 took 0.16 to 0.20 seconds; 398 took 0.21 to 0.25 seconds; 82 took 0.26 to 0.30 seconds; and 56 took 0.31 to 0.35 seconds. Graph the frequency distribution and comment on its shape. A music teacher held an...
SYNOPSIS The product manager for coffee development at Kraft Canada must decide whether to introduce the...
 SYNOPSIS The product manager for coffee development at Kraft Canada must decide whether to introduce the company's new line of single-serve coffee pods or to await results from the product's launch in the United States. Key strategic decisions include choosing the target market to focus on and determining the value proposition to emphasize. Important questions are also raised in regard to how the new product should be branded, the flavors to offer, whether Kraft should use traditional distribution channels or...
All of the following questions are in relation to the following journal article which is available...
 All of the following questions are in relation to the following journal article which is available on Moodle: Parr CL, Magnus MC, Karlstad O, Holvik K, Lund-Blix NA, Jaugen M, et al. Vitamin A and D intake in pregnancy, infant supplementation and asthma development: the Norwegian Mother and Child Cohort. Am J Clin Nutr 2018:107:789-798 QUESTIONS: 1. State one hypothesis the author's proposed in the manuscript. 2. There is previous research that shows that adequate Vitamin A intake is required...
 A manufacturer of dustless chalk instituted a quality control program to monitor chalk density. The sample standard deviations of densities for 24 different subgroups, each consisting of n 8 chalk specimens, were as follows: This data has been coded so that you may copy and paste it into R with the name k.sdevs. k.sdevs c(0.202, 0.315, 0.097, 0.182, 0.229, 0.215, 0.320, 0.288, 0.146, 0.208, 0.050, 0.145, 0.269, 0.350, 0.158. 0.215, 0.386, 0.187, 0.151, 0.231, 0.275, 0.117, 0.091, 0.059) mean(k.sdevs) #Construct...
 f dustless chalk Instituted a quality control program A manufacturer o monitor chalk density. The sample standard deviations of densities for 24 different subgroups, each consisting of n 8 chalk specimens, were as follows: This data has been coded so that you may copy and paste it into R with the name k.sdevs. k.sdevs c(0.207, 0.313, 0.097, 0.186, 0.233, 0.209, 0.319, 0.290, 0.143 0.212, 0.054, 0.146, 0.274, 0.348, 0.161, 0.216, 0.090, 0.056) 0.152, 0.231, 0.274, 0.121, 0.385, 0.188. mean(k.sdevs) #...
 Solve Part 2
First Name Last Name Please put your name on this test and every page that you submit. Please answer the questions and solve the problem in the proper order [1, 2, 3...] 20 points each. tely precisely, and completely as possible 1. Explain Deming's Funnel Experiment. What did he use it for? 2. Differentiate between Pareto Chart and Cause-and-Effect Diagram. Which one should be used first? 3. Explain "The Central Limit Theorem." Why is it so important...
Solve Part 2
First Name Last Name Please put your name on this test and every page that you submit. Please answer the questions and solve the problem in the proper order [1, 2, 3...] 20 points each. tely precisely, and completely as possible 1. Explain Deming's Funnel Experiment. What did he use it for? 2. Differentiate between Pareto Chart and Cause-and-Effect Diagram. Which one should be used first? 3. Explain "The Central Limit Theorem." Why is it so important...
 Please use R program to solve with explanation.
Enterprise Industries produces Fresh, a liquid landry detergent.
The company wishes to study the relationship between price and
demand for the large size bottle of Fresh in its sales regions. The
company has gathered data (see Table) concerning demand for Fresh
in 30 sales regions of equal sales potential.
i = 1,2,.,30 ythe demand for the large size bottle of Fresh (in hundreds of thousand) in sales region i Xithe price (in...
Please use R program to solve with explanation.
Enterprise Industries produces Fresh, a liquid landry detergent.
The company wishes to study the relationship between price and
demand for the large size bottle of Fresh in its sales regions. The
company has gathered data (see Table) concerning demand for Fresh
in 30 sales regions of equal sales potential.
i = 1,2,.,30 ythe demand for the large size bottle of Fresh (in hundreds of thousand) in sales region i Xithe price (in...
 2.56 A researcher from a search engine company runs Internet searches and times how long each one takes. She found that 17 searches took 0.01 to 0.05 seconds; 57 took 0.06 to 0.10 seconds; 134 took 0.11 to 0.15 sec- onds; 146 took 0.16 to 0.20 seconds; 398 took 0.21 to 0.25 seconds; 82 took 0.26 to 0.30 seconds; and 56 took 0.31 to 0.35 seconds. Graph the frequency distribution and comment on its shape. A music teacher held an...
 SYNOPSIS The product manager for coffee development at Kraft Canada must decide whether to introduce the company's new line of single-serve coffee pods or to await results from the product's launch in the United States. Key strategic decisions include choosing the target market to focus on and determining the value proposition to emphasize. Important questions are also raised in regard to how the new product should be branded, the flavors to offer, whether Kraft should use traditional distribution channels or...
 All of the following questions are in relation to the following journal article which is available on Moodle: Parr CL, Magnus MC, Karlstad O, Holvik K, Lund-Blix NA, Jaugen M, et al. Vitamin A and D intake in pregnancy, infant supplementation and asthma development: the Norwegian Mother and Child Cohort. Am J Clin Nutr 2018:107:789-798 QUESTIONS: 1. State one hypothesis the author's proposed in the manuscript. 2. There is previous research that shows that adequate Vitamin A intake is required...
Most questions answered within 3 hours.
-
If you’re standing at the bottom of a hill and asked to evaluate
it while being...
asked 34 minutes ago -
1. Which region has taken the lead in the world of
e-waste handling?
a) European Union...
asked 28 minutes ago -
A 8.15- g bullet from a 9-mm pistol has a velocity of 366.0 m/s.
It strikes...
asked 2 hours ago -
The outstanding bonds of Alpha Extracts have a yield to maturity
of 7.4 percent and a...
asked 1 hour ago -
The Problem: The Case of the Harmonizing Vacations
Your CEO is exploring partnering with a European...
asked 3 hours ago -
A chemical equation is balanced by adding coefficients in front
of some formulas so that the...
asked 3 hours ago -
From the literature (reference your sources): What are the
lattice parameters of calcite and aragonite? Why...
asked 4 hours ago -
Your system is rejecting the question am asking which is
preceded by a case study. It...
asked 4 hours ago -
3. On January 2, 2000, Larry creates a trust with himself as
trustee. Larry as trustee...
asked 4 hours ago -
A member of the volleyball team spikes the ball. During this
process, she changes the velocity...
asked 4 hours ago -
Are adult gamers less likely to use a gaming console (Xbox,
PlayStation, Wii, etc...) than teen...
asked 5 hours ago -
The University of
Texas recently reported that 43% of college students aged 18-24
would spend their...
asked 5 hours ago