13.50 The owner of a moving company typically has his most experienced manager predict the total number of labor hours t...
13.50 The owner of a moving company typically has his most experienced manager predict the total number of labor hours that will be required to complete an upcoming move. This approach has proved useful in the past, but the owner has the business ob-jective of developing a more accurate method of predicting labor hours. In a preliminary effort to provide a more accurate method, the owner has decided to use the number of cubic feet moved and the number of pieces of large furniture as the independent vari-ables and has collected data for 36 moves in which the origin and destination were within the borough of Manhattan in New York City and the travel time was an insignificant portion of the hours worked. The data are organized and stored in Moving .a. State the multiple regression equation.b. Interpret the meaning of the slopes in this equation.c. Predict the mean labor hours for moving 500 cubic feet with two large pieces of furniture.d. Perform a residual analysis on your results and determine whether the regression assumptions are valid.e. Determine whether there is a significant relationship between labor hours and the two independent variables (the number of cubic feet moved and the number of pieces of large furniture) at the 0.05 level of significance.f. Determine the p-value in (e) and interpret its meaning.g. Interpret the meaning of the coefficient of multiple determina-tion in this problem.h. Determine the adjusted r2.i. At the 0.05 level of significance, determine whether each inde-pendent variable makes a significant contribution to the regres-sion model. Indicate the most appropriate regression model for this set of data.j. Determine the p-values in (i) and interpret their meaning.k. Construct a 95% confidence interval estimate of the population slope between labor hours and the number of cubic feet moved. How does the interpretation of the slope here differ from that in Problem 12.44 on page 443?l. What conclusions can you reach concerning labor hours?
Homework Answers
ANSWER"
Given that,
a)
The regression equation is defined as,

Now, the regression analysis is done in excel by following steps
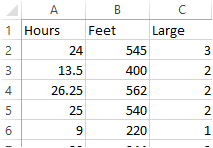
Step 1: Write the data values in excel. The screenshot is shown below,
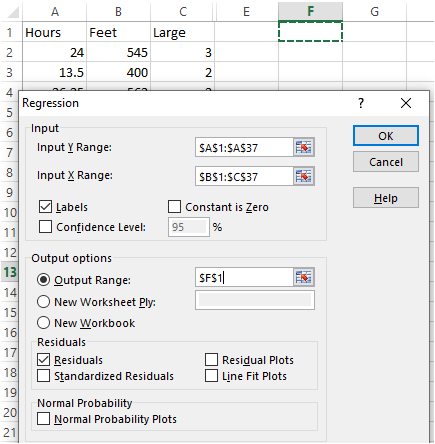
Step 2: DATA > Data Analysis > Regression > OK. The screenshot is shown below,

Step 3: Select Input Y Range: 'Hours' column, Input X Range: 'Feet and Large' column then OK. The screenshot is shown below, (Click on Residual and Residual plot for residual analysis)
The result is obtained. The screenshot is shown below,

The regression equation is,

b)
For response variable Feet,
For each unit increase in Feet, the total number of labor hours will increase by 0.0319.
For response variable Large,
For each unit increase in Large total number of labor hours will increase by 4.2228.
c)
For 500 cubic feet and two large pieces of furniture.

d)
Perform a residual analysis on your results and determine whether the regression assumptions are valid
The residual plot is obtained in excel in part a). The screenshot is shown below,

Since residuals are randomly dispersed, the multiple linear regression model assumptions are valid for the data;
e)
From the regression model summary,
| ANOVA | |||||
| df | SS | MS | F | Significance F | |
| Regression | 2 | 7248.705601 | 3624.353 | 228.8049 | 4.55335E-20 |
| Residual | 33 | 522.7318989 | 15.84036 | ||
| Total | 35 | 7771.4375 |
The significance F value which is the P-value is less than 0.05 at 5% significance level. hence the regression model is significant
f)
| P-value | 4.55335E-20 |
The significance level represents the percent of error that the difference exist between actual and hypothesized parameter. If the The P-value is less than significance level, the null hypothesis is rejected and we can conclude that there is no difference in reject.
g)
The coefficient of multiple determination is the R squared value in the regression model. From the regression model in part a)
| R Square | 0.932736781 |
Which means the regression model explains the 93.27% of the variance of data set.
h)
| Adjusted R Square | 0.928660223 |
It is the modified R-squared value that adjusted for for the number of predictors in the model such that if the newly added independent variable is insignificant, the R squared doesn't increase.
i)
The hypothesis is tested by calculating t-value and corresponding p-value for the estimated slope in regression model as shown below,
Null Hypothesis: 
Alternate Hypothesis: 
The P-value is obtained in regression analysis in part a).
| P-value | Significance level | Decision | ||
| Feet | 6.36E-08 | < | 0.05 | Null hypothesis is rejected, hence significant relationship |
| Large | 5.64E-05 | < | 0.05 | Null hypothesis is rejected, hence significant relationship |
j)
| P-value | |
| Feet | 6.36E-08 |
| Large | 5.64E-05 |
The p-value is the probability of finding the observed, or more extreme, results when the null hypothesis is true which means it is the probability of occurrence of an event at the extreme point (significance level).
k)
From the regression model 95% confidence interval estimate of the population slope are,
| Lower 95% | Upper 95% | |
| Feet | 0.0226 | 0.0413 |
| Large | 2.3629 | 6.0828 |
conclusion:
The independent variable number of cubic feet moved and the number of pieces of large furniture significantly explain the total number of labor hours that will be required to complete an upcoming move
Add Answer to:
13.50 The owner of a moving company typically has his most experienced manager predict the total number of labor hours t...
The owner of a moving company typically has his most experienced manager predict the total number...
The owner of a moving company typically has his most experienced manager predict the total number of labor hours that will be required to complete an upcoming move. This approach has proved useful in the past, but the owner has the business objective of developing a more accurate method of predicting labor hours. In a preliminary effort to provide a more accurate method, the owner has decided to use the number of cubic feet moved and the number of pieces...
The owner of a moving company typically has his most experienced manager predict the total number...
The owner of a moving company typically has his most experienced manager predict the total number of labor hours that will be required to complete an upcoming move. In a effort to provide a more accurate method, the owner has decided to use the number of cubic feet moved as the independent variable and has collected data for 20 moves in which the travel time was an insignificant portion of the hours worked. Use the data provided to complete parts...
The owner of a moving company typically has his most experienced manager predict the total number...
The owner of a moving company typically has his most experienced manager predict the total number of labor hours that will be required to complete an upcoming move. This approach has proved useful in the past, but the owner has the business objective of developing a more accurate method of predicting labor hours. In a preliminary effort to provide a more accurate method, the owner has decided to use the number of cubic feet moved as the independent variable and...
The owner of a TIoving company typically has his riost experienced manager predict the total number...
 The owner of a TIoving company typically has his riost experienced manager predict the total number of labor hours that will be required to complete an upcoming move. In an effort to provide a more accurate method, the owner has Use the data provided to complete parts (a) which the travel tirme was aı insignificant portion of the hours worker number of cubic feet moved as the independent variable and has collected data for 20 moves through (d) below EClick...
The owner of a moving company usually has her most experienced manager predict the total number of labor hours required to complete a move. While useful, the owner is interested in a more accurate met...
 The owner of a moving company usually has her most experienced
manager predict the total number of labor hours required to
complete a move. While useful, the owner is interested in a more
accurate method of predicting the number of labor hours required.
As a preliminary effort, data was collected on the number of work
hours required to complete a move, number of cubic feet moved, the
number of large pieces, and if an elevator was present.
How much correlation...
The owner of a moving company usually has her most experienced
manager predict the total number of labor hours required to
complete a move. While useful, the owner is interested in a more
accurate method of predicting the number of labor hours required.
As a preliminary effort, data was collected on the number of work
hours required to complete a move, number of cubic feet moved, the
number of large pieces, and if an elevator was present.
How much correlation...
The owner of a moving company wants to predict labor hours, based on the number of...
The owner of a moving company wants to predict labor hours, based on the number of cubic feet moved. A total of 34 observations were made. An analysis of variance of these data showed that b1=0.0426 and Upper Sb1=0.0065. a. At the 0.05 level of significance, is there evidence of a linear relationship between the number of cubic feet moved and labor hours? b. Construct a 95% confidence interval estimate of the population slope β1. a. Determine the hypotheses for...
Cubic_Feet_Moved Labor_Hours 552 22.50 567 24.25 565 21.25 518 20.00 647 25.75 256 11.00 667 31.25 555 25.00 329 14.00 686 31.50 539 25.50 810 38.00 355 12.00 465 22.75 624 29.00 400 16.25 720 31.75 6...
Cubic_Feet_Moved Labor_Hours 552 22.50 567 24.25 565 21.25 518 20.00 647 25.75 256 11.00 667 31.25 555 25.00 329 14.00 686 31.50 539 25.50 810 38.00 355 12.00 465 22.75 624 29.00 400 16.25 720 31.75 680 29.50 719 29.50 714 33.75 The owner of a moving company typically has his most experienced manager predict the total number of labor hours that will be required to complete an upcoming move. In an effort to provide a more accurate method, the...
Cubic_Feet_Moved Labor_Hours 552 22.50 567 24.25 565 21.25 518 20.00 647 25.75 256 11.00 667 31.25...
Cubic_Feet_Moved Labor_Hours 552 22.50 567 24.25 565 21.25 518 20.00 647 25.75 256 11.00 667 31.25 555 25.00 329 14.00 686 31.50 539 25.50 810 38.00 355 12.00 465 22.75 624 29.00 400 16.25 720 31.75 680 29.50 719 29.50 714 33.75 The owner of a moving company typically has his most experienced manager predict the total number of labor hours that will be required to complete an upcoming move. In an effort to provide a more accurate method, the...
PLEASE SHOW ALL EXCEL FORMULAS USED FOR EACH CALCULATIONS. A STEP BY STEP WALKTHROUGH OF HOW TO DO THE PROBLEM. Thank you so much for your help! Hours Feet Elevator Elevator code 24.00 545 Y...
 PLEASE SHOW ALL EXCEL FORMULAS USED FOR EACH CALCULATIONS. A
STEP BY STEP WALKTHROUGH OF HOW TO DO THE PROBLEM. Thank you so
much for your help!
Hours Feet Elevator Elevator
code
24.00 545 Yes 1
13.50 400 Yes 1
26.25 562 No 0
25.00 540 No 0
9.00 220 Yes 1
20.00 344 Yes 1
22.00 569 Yes 1
11.25 340 Yes 1
50.00 900 Yes 1
12.00 285 Yes 1
38.75 865 Yes 1
40.00 831 Yes 1...
PLEASE SHOW ALL EXCEL FORMULAS USED FOR EACH CALCULATIONS. A
STEP BY STEP WALKTHROUGH OF HOW TO DO THE PROBLEM. Thank you so
much for your help!
Hours Feet Elevator Elevator
code
24.00 545 Yes 1
13.50 400 Yes 1
26.25 562 No 0
25.00 540 No 0
9.00 220 Yes 1
20.00 344 Yes 1
22.00 569 Yes 1
11.25 340 Yes 1
50.00 900 Yes 1
12.00 285 Yes 1
38.75 865 Yes 1
40.00 831 Yes 1...
Trying to avoid over- or under-allocating labour hours in a particular moving job, the owner of...
Trying to avoid over- or under-allocating labour hours in a particular moving job, the owner of a moving company would like to develop a better method of predicting labour hours (Duration; measured in hours) by using the size of the apartment (Size; measured in cubic feet) moved. A random sample of 36 moves in the past year was randomly selected in the borough of Manhattan in New York City. The data set “S1181 HW2 Q5 Data.xlsx” is available on D2L....
 The owner of a TIoving company typically has his riost experienced manager predict the total number of labor hours that will be required to complete an upcoming move. In an effort to provide a more accurate method, the owner has Use the data provided to complete parts (a) which the travel tirme was aı insignificant portion of the hours worker number of cubic feet moved as the independent variable and has collected data for 20 moves through (d) below EClick...
 The owner of a moving company usually has her most experienced
manager predict the total number of labor hours required to
complete a move. While useful, the owner is interested in a more
accurate method of predicting the number of labor hours required.
As a preliminary effort, data was collected on the number of work
hours required to complete a move, number of cubic feet moved, the
number of large pieces, and if an elevator was present.
How much correlation...
The owner of a moving company usually has her most experienced
manager predict the total number of labor hours required to
complete a move. While useful, the owner is interested in a more
accurate method of predicting the number of labor hours required.
As a preliminary effort, data was collected on the number of work
hours required to complete a move, number of cubic feet moved, the
number of large pieces, and if an elevator was present.
How much correlation...
 PLEASE SHOW ALL EXCEL FORMULAS USED FOR EACH CALCULATIONS. A
STEP BY STEP WALKTHROUGH OF HOW TO DO THE PROBLEM. Thank you so
much for your help!
Hours Feet Elevator Elevator
code
24.00 545 Yes 1
13.50 400 Yes 1
26.25 562 No 0
25.00 540 No 0
9.00 220 Yes 1
20.00 344 Yes 1
22.00 569 Yes 1
11.25 340 Yes 1
50.00 900 Yes 1
12.00 285 Yes 1
38.75 865 Yes 1
40.00 831 Yes 1...
PLEASE SHOW ALL EXCEL FORMULAS USED FOR EACH CALCULATIONS. A
STEP BY STEP WALKTHROUGH OF HOW TO DO THE PROBLEM. Thank you so
much for your help!
Hours Feet Elevator Elevator
code
24.00 545 Yes 1
13.50 400 Yes 1
26.25 562 No 0
25.00 540 No 0
9.00 220 Yes 1
20.00 344 Yes 1
22.00 569 Yes 1
11.25 340 Yes 1
50.00 900 Yes 1
12.00 285 Yes 1
38.75 865 Yes 1
40.00 831 Yes 1...
Most questions answered within 3 hours.
-
A construction company is planning to bid on a building
contract. The bid costs the company...
asked 7 minutes ago -
A sample of 45 observations is selected from a normal
population. The sample mean is 49,...
asked 10 minutes ago -
A firm operating in a purely competitive environment is faced
with a market price of $250....
asked 14 minutes ago -
•Let’s say someone claims the average population size is
600 feet squared and the housing authority...
asked 22 minutes ago -
Cynaide is a deadly poison that blocks the last step in the
electron transport chain of...
asked 26 minutes ago -
Your friend tells you that there is a vending machine on campus
that dispenses M&M packs...
asked 41 minutes ago -
What advantages are there to using piperidine rather than
hydroxide as a base?
asked 39 minutes ago -
7. The life of a Freeze Breeze electric fan is normally
distributed with a mean 4...
asked 43 minutes ago -
1. A 751 mL NaCl solution is diluted to a volume of 1.06 L and a...
asked 47 minutes ago -
8
A $20,000 face value STRIPS is currently quoted at 38.642 and
has 8 years to...
asked 48 minutes ago -
The current exchange rate between the Japanese yen and
the US dollar is 120 yen per...
asked 50 minutes ago -
Marla’s Massages and More bought a special massage table two
years ago for $9,300. At the...
asked 57 minutes ago