
Homework Answers
1.
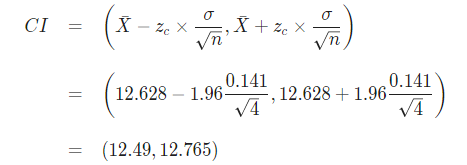
(d)
α=0.05
Critical Z=Z1−α/2=1.96
(e)
Mean = (11.54 + 10.88 + 11.12 + 10.58 + 11.1 + 11.68 + 11.78 +
10.99 + 11.04 + 10.5 + 10.97)/11
= 122.18/11
Mean = 11.107
(f)
Standard Deviation σ = √(1/11 - 1) x ((11.54 -
11.1073)2 + (10.88 - 11.1073)2 + (11.12 -
11.1073)2 + (10.58 - 11.1073)2 + (11.1 -
11.1073)2 + (11.68 - 11.1073)2 + (11.78 -
11.1073)2 + (10.99 - 11.1073)2 + (11.04 -
11.1073)2 + (10.5 - 11.1073)2 + (10.97 -
11.1073)2)
= √(1/10) x ((0.4327)2 + (-0.2273)2 +
(0.012699999999999)2 + (-0.5273)2 +
(-0.0073000000000008)2 + (0.5727)2 +
(0.6727)2 + (-0.1173)2 +
(-0.067300000000001)2 + (-0.6073)2 +
(-0.1373)2)
= √(0.1) x ((0.1872) + (0.0517) + (0.0002) + (0.278) + (0.0001) +
(0.328) + (0.4525) + (0.0138) + (0.0045) + (0.3688) +
(0.0189))
= √(0.1) x 1.7036
= √0.1704
Standard Deviation σ = 0.413
(g)
Standard Error = σ√n
= 0.4127√11
= 0.41273.3166
Standard Error = 0.124
(h)
α=0.05
Critical Z=Z1−α/2=1.96

Add Answer to:
analve the mework on confidence intervals, you will use JMP to analyze the Deflategate data set....
3. As with the previous homework, we want to compare the average decrease in PSI between the two ...
 3. As with the previous homework, we want to compare the average decrease in PSI between the two teams. Create a new column for decrease in PST, defined as PST Pregarne minus PST_Halftime. Use "Analyze Fit Y by X", select the appropriate variables (see the notes if you have trouble with this), hit "OK", then select "t Test" from the drop down menu on the next screen. The results that you ignored in the previous homework are the results of...
For a random sample of 36 data pairs, the sample mean of the differences was 0.72....
 For a random sample of 36 data pairs, the sample mean of the differences was 0.72. The sample standard deviation of the differences was 2. At the 5% level of significance, test the claim that the population mean of the differences is different from 0. (a) Is it appropriate to use a Student's t distribution for the sample test statistic? Explain. No, the sample size is not larger than 30. Yes, the sample size is larger than 30. No, the...
A sample mean, sample standard deviation, and sample size are given. Use the one meant test...
 A sample mean, sample standard deviation, and sample size are given. Use the one meant test to perform the required hypothesis test about the mean, , of the population from which the sample was drawn. Use the P-value approach. Also, assess the strength of the evidence against the null hypothesis. x-22,298, s=14200, n = 17, HO: P = 30,000, Ha# 30,000 a -0.05. Test statistic: 224. P.value 0.0200. Reject the null hypothesis. There is sufficient evidence to conclude that the...
A random sample of 16 values is drawn from a mound-shaped and symmetric distribution. The sample...
A random sample of 16 values is drawn from a mound-shaped and symmetric distribution. The sample mean is 15 and the sample standard deviation is 2. Use a level of significance of 0.05 to conduct a two-tailed test of the claim that the population mean is 14.5. (a) Is it appropriate to use a Student's t distribution? Explain. Yes, because the x distribution is mound-shaped and symmetric and σ is unknown.No, the x distribution is skewed left. No, the x distribution...
A random sample of 16 values is drawn from a mound-shaped and symmetric distribution. The sample...
A random sample of 16 values is drawn from a mound-shaped and symmetric distribution. The sample mean is 9 and the sample standard deviation is 2. Use a level of significance of 0.05 to conduct a two-tailed test of the claim that the population mean is 8.5. (a) Is it appropriate to use a Student's t distribution? Explain. Yes, because the x distribution is mound-shaped and symmetric and σ is unknown. No, the x distribution is skewed left. No, the...
Open the "Lab Dataset" (HSCI390.sav) you have been using for lab assignments in SPSS. Your analysis...
 Open the "Lab Dataset"
(HSCI390.sav) you have been using for lab assignments in SPSS. Your
analysis will focus on the variables "Gender" (Gender) and "Blood
Alcohol Content at last drinking episode" (BAC).
Researchers are interested in examining if the mean Blood
Alcohol Content at last drinking episode differs between men and
women. To examine their research question of interest, they will
use data from the sample of CSUN students contained in the
HSCI390.sav dataset.
Using SPSS for the analysis, you...
Open the "Lab Dataset"
(HSCI390.sav) you have been using for lab assignments in SPSS. Your
analysis will focus on the variables "Gender" (Gender) and "Blood
Alcohol Content at last drinking episode" (BAC).
Researchers are interested in examining if the mean Blood
Alcohol Content at last drinking episode differs between men and
women. To examine their research question of interest, they will
use data from the sample of CSUN students contained in the
HSCI390.sav dataset.
Using SPSS for the analysis, you...
On a certain portion of an experiment, a statistical test result yielded a p-value of 0.15. What can you conclude? If the null hypothesis is true, one could expect to get a test statistic at least as...
On a certain portion of an experiment, a statistical test result yielded a p-value of 0.15. What can you conclude? If the null hypothesis is true, one could expect to get a test statistic at least as extreme as that observed 15% of the time, so the test is not statistically significant. 2(0.15) = 0.30 < 0.5; the test is not statistically significant. 0.15 > 0.05; the test is statistically significant. If the null hypothesis is true, one could expect...
For the following questions, you will use the following data on particulate matter in air samples:...
For the following questions, you will use the following data on particulate matter in air samples: Site Sample Size Mean Std. Dev. 1 8 36.25 14.56 2 8 36.00 2.88 You will test for a significant difference between means at the alpha=0.05 level. Calculate the standard error of the mean difference. Calculate the test statistic. What are the degrees of freedom? Should you reject or retain the null hypothesis In a study on differences in urinary creatinine levels...
For the past 16 years, the yields of wheat (in tons) grown on a plot at...
For the past 16 years, the yields of wheat (in tons) grown on a plot at Rothamsted Experimental Station (England) are shown below. The sequence is by year. 1.4 1.3 0.7 1.9 2.1 3.4 3.1 1.9 2.8 2.4 2.5 2.2 2.4 2.6 1.7 3.7 Use level of significance 5% to test for randomness about the median. (a) State the test used. spearman correlation testsign test rank-sum testruns test (b) Give ?. State the null and alternate hypotheses. Ho: The numbers are...
Would you favor spending more federal tax money on the arts? Of a random sample of...
 Would you favor spending more federal tax money on the arts? Of a random sample of n = 93 politically conservative voters, 1 = 17 responded yes. Another random sample of n2 = 78 politically moderate voters showed that r2 - 22 responded yes. Does this information indicate that the population proportion of conservative voters inclined to spend more federal tax money on funding the arts is less than the proportion of moderate voters so inclined? Use a = 0.05....
 3. As with the previous homework, we want to compare the average decrease in PSI between the two teams. Create a new column for decrease in PST, defined as PST Pregarne minus PST_Halftime. Use "Analyze Fit Y by X", select the appropriate variables (see the notes if you have trouble with this), hit "OK", then select "t Test" from the drop down menu on the next screen. The results that you ignored in the previous homework are the results of...
 For a random sample of 36 data pairs, the sample mean of the differences was 0.72. The sample standard deviation of the differences was 2. At the 5% level of significance, test the claim that the population mean of the differences is different from 0. (a) Is it appropriate to use a Student's t distribution for the sample test statistic? Explain. No, the sample size is not larger than 30. Yes, the sample size is larger than 30. No, the...
 A sample mean, sample standard deviation, and sample size are given. Use the one meant test to perform the required hypothesis test about the mean, , of the population from which the sample was drawn. Use the P-value approach. Also, assess the strength of the evidence against the null hypothesis. x-22,298, s=14200, n = 17, HO: P = 30,000, Ha# 30,000 a -0.05. Test statistic: 224. P.value 0.0200. Reject the null hypothesis. There is sufficient evidence to conclude that the...
 Open the "Lab Dataset"
(HSCI390.sav) you have been using for lab assignments in SPSS. Your
analysis will focus on the variables "Gender" (Gender) and "Blood
Alcohol Content at last drinking episode" (BAC).
Researchers are interested in examining if the mean Blood
Alcohol Content at last drinking episode differs between men and
women. To examine their research question of interest, they will
use data from the sample of CSUN students contained in the
HSCI390.sav dataset.
Using SPSS for the analysis, you...
Open the "Lab Dataset"
(HSCI390.sav) you have been using for lab assignments in SPSS. Your
analysis will focus on the variables "Gender" (Gender) and "Blood
Alcohol Content at last drinking episode" (BAC).
Researchers are interested in examining if the mean Blood
Alcohol Content at last drinking episode differs between men and
women. To examine their research question of interest, they will
use data from the sample of CSUN students contained in the
HSCI390.sav dataset.
Using SPSS for the analysis, you...
 Would you favor spending more federal tax money on the arts? Of a random sample of n = 93 politically conservative voters, 1 = 17 responded yes. Another random sample of n2 = 78 politically moderate voters showed that r2 - 22 responded yes. Does this information indicate that the population proportion of conservative voters inclined to spend more federal tax money on funding the arts is less than the proportion of moderate voters so inclined? Use a = 0.05....
Most questions answered within 3 hours.
-
The blues made its way into many kinds of music. Eric Clapton,
The Beatles, and Elvis...
asked 1 hour ago -
8. A wave in a string has a wave function given by: y (x, t) =...
asked 21 minutes ago -
If you’re standing at the bottom of a hill and asked to evaluate
it while being...
asked 2 hours ago -
1. Which region has taken the lead in the world of
e-waste handling?
a) European Union...
asked 2 hours ago -
A 8.15- g bullet from a 9-mm pistol has a velocity of 366.0 m/s.
It strikes...
asked 3 hours ago -
The outstanding bonds of Alpha Extracts have a yield to maturity
of 7.4 percent and a...
asked 3 hours ago -
The Problem: The Case of the Harmonizing Vacations
Your CEO is exploring partnering with a European...
asked 4 hours ago -
A chemical equation is balanced by adding coefficients in front
of some formulas so that the...
asked 4 hours ago -
From the literature (reference your sources): What are the
lattice parameters of calcite and aragonite? Why...
asked 5 hours ago -
Your system is rejecting the question am asking which is
preceded by a case study. It...
asked 5 hours ago -
3. On January 2, 2000, Larry creates a trust with himself as
trustee. Larry as trustee...
asked 5 hours ago -
A member of the volleyball team spikes the ball. During this
process, she changes the velocity...
asked 5 hours ago