

 Consider the following
scenario: Your boss has come to you for advice on the current
finances of the company and needs you to create an extended DuPont
analysis, common size analysis, and percentage change analysis.
Your boss wants you to fill out the attached Excel file because
he/she has no idea what she is talking about and is going to use
your report as her work.
Consider the following
scenario: Your boss has come to you for advice on the current
finances of the company and needs you to create an extended DuPont
analysis, common size analysis, and percentage change analysis.
Your boss wants you to fill out the attached Excel file because
he/she has no idea what she is talking about and is going to use
your report as her work.
Remember to answer all the questions in the attached document.
- Has J&W's liquidity position improved or worsened? Explain
- Has J&W's ability to manage its assets improved or worsened? Explain
- How has J&W's profitability changed during the last year?
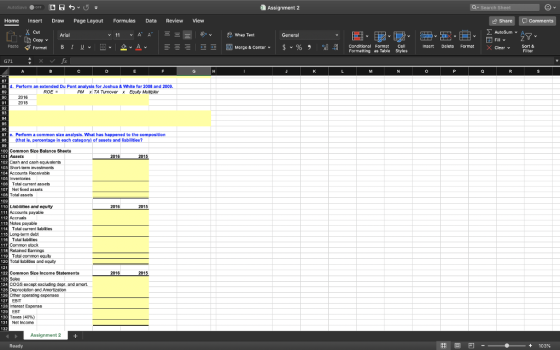
- Perform an extended DuPont analysis for J7W for 2015 and 2016. What do these results tell you?
- Perform a common size analysis. What has happened to the composition (That is, the percentage in each category) of assets and liabilities?
- Perform a percentage change analysis. What does this tell you about the change in profitability and asset utilization?
Homework Answers
| Extended DuPont Equation Analysis: |
| ROE=Profit Margin*Total Asset Turnover*Equity multiplier or Financial Leverage |
| ROE=(Net Income/Sales)*(Sales/Total assets)*(Total Assets/Total Equity) |
| Splitting the 1st ratio further, |
| we can have an extened DuPont equation for ROE , to facilitate easy analysis |
| Profit Margin=Tax Burden*Int. Burden*EBIT/Opg. Income Margin |
| Stating together, |
| ROE=(Net Income/EBT)*(EBT/EBIT)*(EBIT/Sales)*(Sales/Total assets)*(Total Assets/Total Equity) |
| Putting the values, |
| ROE (2015) =(34524/57540)*(57540/62000)*(62000/400000)*(400000/327240)*(327240/218440)= |
| 0.6*0.9281*0.155*1.2223*1.4981= |
| 15.81% |
| ROE (2016) =(40200/67000)*(67000/72740)*(72740/420000)*(420000/379659)*(379659/245868)= |
| 0.6*0.9211*0.1732*1.1063*1.5442= |
| 16.35% |
| Comparing 2015 & 2016 |
| Tax burden remains the same . |
| Interest burden is also almost the same |
| Operating margin has increased |
| So, Profit margin has increased indicating operational efficiency . |
| Asset utilisation has come down---as can be seen that $ sales generated per $ of asset employed has come down from 1.22 in 2015 to 1.10 in 2016. |
| Increase in assets is greater than increase in sales. |
| Equity multiplier has increased from 1.50 (rounded-off) in 2015 to 1.54 in 2016. |
| Due to more than proportionate increase in assets than the increase in equity(denominator)---so concluded because interest burden on pre-tax income remains almost same in 2016 -- |
| Conclusion: main reason for increase in ROE is due to the increase in operating margin , indicating operational efficiency. |
Answers as per Format
| RATIO ANALYSIS | |||
| Liquidity Ratios | |||
| Current ratio ( Current assets/Current Liabilities | |||
| 2015 | 2016 | Ind. Av. | |
| 1.Current assets | 127240 | 161259 | |
| 2.Current Liabilities | 50480 | 66129 | |
| 3. Current Ratio(1/2) | 2.52 | 2.44 | 2.58 |
| Quick ratio= (Current assets-Inventories)/Current Liabilities | |||
| 1.Current assets | 127240 | 161259 | |
| 2.Inventories | 56000 | 84000 | |
| 3.Quick assets(1-2) | 71240 | 77259 | |
| 4.Current Liabilities | 50480 | 66129 | |
| 5. Quick ratio (3/4) | 1.41 | 1.17 | 1.53 |
| Asset Management Ratios | |||
| Inventory Turnover(Total COGS/Inventories) | 298000/56000= | 300000/84000= | |
| (Times in a Year) | 5.32 | 3.57 | 7.69 |
| Days Sales O/s (365/(Credit Sales/A/cs. Receivables)) | 365/(400000/48000)= | 365/(420000/52500)= | |
| (Days) | 43.80 | 45.63 | 47.45 |
| Fixed Assets Turnover(Sales/Total Fixed assets) | 400000/200000= | 420000/218400= | |
| 2 | 1.92 | 2.04 | |
| Total Assets turnover(Sales/Total Assets) | 400000/327240= | 420000/379659= | |
| 1.22 | 1.11 | 1.23 | |
| Debt Management Ratios | |||
| Debt ratio(total debt-to-assets) | 58320/327240= | 67662/379659= | |
| 17.82% | 17.82% | 20% | |
| Liabilities-to-assets ratio (total Liabilities/total assets | 108800/327240= | 133791/379659= | |
| 33.25% | 35.24% | 32.1% | |
| Times-interest -earned ratio(EBIT/Interest Expense) | 62000/4460= | 72740/5740= | |
| 13.90 | 12.67 | 15.33 | |
| EBITDA coverage ratio(EBITDA + Lease Payments)/Interest Payments + Principal Repayments + Lease Payments | |||
| EBITDA: | |||
| Net Income | 34524 | 40200 | |
| Add:Interest expense | 4460 | 5740 | |
| Add: Taxes | 23016 | 26800 | |
| Add:Depn. Amortsn. | 18000 | 19660 | |
| EBITDA | 80000 | 92400 | |
| EBITDA coverage ratio | (80000+20000)/(4460+5000+20000)= | (92400+20000)/(5740+5000+20000)= | |
| 3.39 | 3.66 | 4.18 | |
| Profitability Ratios: | |||
| Profit Margin(net Income/Sales) | 34524/400000= | 40200/420000= | |
| 8.63% | 9.57% | 8.80% | |
| Basic Earning Power (EBIT/Total assets) | 62000/327240= | 72740/379659= | |
| 18.95% | 19.16% | 19.48% | |
| Return on Assets(Net income/Total assets) | 34524/327240= | 40200/379659= | |
| 10.55% | 10.59% | 10.03% | |
| Return on Equity(net Income/Total Equity) | 34524/218440= | 40200/245868= | |
| 15.80% | 16.35% | 16.10% | |
| Market Value Ratios: | |||
| Earnings per share (net Income/Total no.of common shares o/s | 34524/4000= | 40200/4052= | |
| 8.63 | 9.92 | NA | |
| Price-to Earnings ratio(market price per share/Earnings per share | 96/8.63= | 90/9.92= | |
| 11.12 | 9.07 | 10.65 | |
| Cash flow per share | |||
| Price-to-cash flow rate | |||
| Book value per share(stockholders'equity/No.of shares o/s) | 218440/4000= | 245868/4020= | |
| 54.61 | 61.16 | NA | |
| Market to Book ratio (market price/book value )per share | 96/54.61= | 90/61.16= | |
| 1.76 | 1.47 | 1.72 | |
| a. Liquidity position:Compared to the Industry average, both the current & quick ratios have been less in both the years. Both ratios have worsened in 2016 , due to increase in Notes payable. | |||
| b. Asset management ratios: | |||
| Inventory turnover is very low (compared to industry average),in both years-decreasing even more in 2016--on the whole,indicating excess inventory held , for the type of industry. | |||
| Receivables collection are better than the industry average--as indicated by the lesser no.of days , it had taken to be collected in both the years. | |||
| $ sales generated per $ of fixed assets , has decreased in 2016 , after being on par with the industry in 2015. | |||
| $ sales generated per $ of total assets , also has decreased in 2016 , after being on par with the industry in 2015. | |||
| Investment in inventory & fixed assets seems to be on the higher side compared to industry. | |||
| c. Profitabilty ratios: | |||
| Overall profit margin , better than industry avearge. | |||
| Basic earning power has been less(compared to the industry average) in both the years, probably due to more investment in fixed assets | |||
| ROA is better than the industry average in both the years | |||
| ROE is almost on par in 2015 & increased in 2016 | |||
| Overall, profitability is good. | |||
| d. DuPont equation Analysis: | ||||
| ROE= | Profit margin* | Total assets turnover* | Equity Multiplier | |
| 2015 | 34524/400000= | 400000/327240= | 327240/218440= | |
| 8.63% | 1.22 | 1.4981 | ||
| 15.80% | ||||
| 2016 | 40200/420000= | 420000/379659= | 379659/245868= | |
| 9.57% | 1.11 | 1.5442 | ||
| 16.35% | ||||
| Joshua & White Technologies ,Dec.31, Balance sheets | |||||
| (in '000s of $) | |||||
| e. Common- size balance sheet | 2015 | % to Total assets | 2016 | % to Total assets | Effect |
| Assets | |||||
| Cash & Cash equivalents | 20000 | 6.11% | 21000 | 5.53% | Decrease |
| Short-term Investments | 3240 | 0.99% | 3759 | 0.99% | Same |
| Accounts Receivable | 48000 | 14.67% | 52500 | 13.83% | Decrease |
| Investments | 56000 | 17.11% | 84000 | 22.13% | Increase |
| Total Current assets | 127240 | 38.88% | 161259 | 42.47% | Increase |
| Net Fixed assets | 200000 | 61.12% | 218400 | 57.53% | Decrease |
| Total Assets | 327240 | 100.00% | 379659 | 100.00% | |
| Liabilities & Equity | |||||
| Accounts payable | 32000 | 9.78% | 33600 | 8.85% | Decrease |
| Accruals | 12000 | 3.67% | 12600 | 3.32% | Decrease |
| Notes payable | 6480 | 1.98% | 19929 | 5.25% | Increase |
| Total Current liabilities | 50480 | 15.43% | 66129 | 17.42% | Increase |
| Long-term debt | 58320 | 17.82% | 67662 | 17.82% | Same |
| Total Liabilities | 108800 | 33.25% | 133791 | 35.24% | Increase |
| Common stock | 178440 | 54.53% | 183793 | 48.41% | Decrease |
| Retained Earnings | 40000 | 12.22% | 62075 | 16.35% | Increase |
| Total Common equity | 218440 | 66.75% | 245868 | 64.76% | Decrease |
| Total Liabilities & Equity | 327240 | 100.00% | 379659 | 100.00% | |
| Income statement | |||||
| Sales | 400000 | 100.00% | 420000 | 100.00% | |
| COGS | 298000 | 74.50% | 300000 | 71.43% | Decrease |
| Depn. & Amortsn. | 18000 | 4.50% | 19660 | 4.68% | Increase |
| Other Opg. Exp. | 22000 | 5.50% | 27600 | 6.57% | Increase |
| EBIT | 62000 | 15.50% | 72740 | 17.32% | Increase |
| Interest expense | 4460 | 1.12% | 5740 | 1.37% | Increase |
| EBT | 57540 | 14.39% | 67000 | 15.95% | Increase |
| Taxes at 40% | 23016 | 5.75% | 26800 | 6.38% | Increase |
| Net Income | 34524 | 8.63% | 40200 | 9.57% | Increase |
| Common dividends (as % of net Income ) | 17262 | 50% | 18125 | 45% | Decrease |
| Addition to retained earnings (as % of net Income) | 17262 | 50% | 22075 | 55% | Increase |
| Joshua & White Technologies ,Dec.31, Balance sheets | |||
| (in '000s of $) | |||
| f. % change in 2016 from 2015 | 2015(Base) | 2016 | (2016-2015)/2015(%) |
| Assets | |||
| Cash & Cash equivalents | 20000 | 21000 | 5.00% |
| Short-term Investments | 3240 | 3759 | 16.02% |
| Accounts Receivable | 48000 | 52500 | 9.38% |
| Investments | 56000 | 84000 | 50.00% |
| Total Current assets | 127240 | 161259 | 26.74% |
| Net Fixed assets | 200000 | 218400 | 9.20% |
| Total Assets | 327240 | 379659 | 16.02% |
| Liabilities & Equity | |||
| Accounts payable | 32000 | 33600 | 5.00% |
| Accruals | 12000 | 12600 | 5.00% |
| Notes payable | 6480 | 19929 | 207.55% |
| Total Current liabilities | 50480 | 66129 | 31.00% |
| Long-term debt | 58320 | 67662 | 16.02% |
| Total Liabilities | 108800 | 133791 | 22.97% |
| Common stock | 178440 | 183793 | 3.00% |
| Retained Earnings | 40000 | 62075 | 55.19% |
| Total Common equity | 218440 | 245868 | 12.56% |
| Total Liabilities & Equity | 327240 | 379659 | 16.02% |
| Income statement | |||
| Sales | 400000 | 420000 | 5.00% |
| COGS | 298000 | 300000 | 0.67% |
| Depn. & Amortsn. | 18000 | 19660 | 9.22% |
| Other Opg. Exp. | 22000 | 27600 | 25.45% |
| EBIT | 62000 | 72740 | 17.32% |
| Interest expense | 4460 | 5740 | 28.70% |
| EBT | 57540 | 67000 | 16.44% |
| Taxes at 40% | 23016 | 26800 | 16.44% |
| Net Income | 34524 | 40200 | 16.44% |
| Common dividends (as % of net Income ) | 17262 | 18125 | 5.00% |
| Addition to retained earnings (as % of net Income) | 17262 | 22075 | 27.88% |
| % change(increase) in assets & % change in profitability (Increase) are almost equal---a little higher than 16% | |||
Add Answer to:
Consider the following scenario: Your boss has come to you for advice on the current finances...
Consider the following scenario: Your boss has come to you for advice on the current finances...
 Consider the following scenario: Your boss has come to you for
advice on the current finances of the company and needs you to
create an extended DuPont analysis, common size analysis, and
percentage change analysis. Your boss wants you to fill out the
attached Excel file because he/she has no idea what she is talking
about and is going to use your report as her work. Remember to
answer all the questions in the attached document. Has J&W's
liquidity position...
Consider the following scenario: Your boss has come to you for
advice on the current finances of the company and needs you to
create an extended DuPont analysis, common size analysis, and
percentage change analysis. Your boss wants you to fill out the
attached Excel file because he/she has no idea what she is talking
about and is going to use your report as her work. Remember to
answer all the questions in the attached document. Has J&W's
liquidity position...
Your boss is back. This time he/she provides you a partial model to a bond valuation....
 Your boss is back. This time he/she provides you a partial model
to a bond valuation. This bond is a 20-year, 8% semiannual coupon
bond with a par value of $1,000 may be called in 5 years at a call
price of $1,040. The bond sells for $1,100. (Assume that the bond
has been issued.) She needs you to complete the partial model for
her. She needs the following to be answered.
What is the bond's yield to maturity?
What...
Your boss is back. This time he/she provides you a partial model
to a bond valuation. This bond is a 20-year, 8% semiannual coupon
bond with a par value of $1,000 may be called in 5 years at a call
price of $1,040. The bond sells for $1,100. (Assume that the bond
has been issued.) She needs you to complete the partial model for
her. She needs the following to be answered.
What is the bond's yield to maturity?
What...
Notes Based on year-end balance sheet figures. Calculation is based on a 365-day year. SPREADSHEET PROBLEM...
 Notes Based on year-end balance sheet figures. Calculation is based on a 365-day year. SPREADSHEET PROBLEM (3-15) Analysis Start with the partial model in the file Ch03 P15 Build a Model.XIS From the textDOORS Web site. Joshua & White (J&W) Technology's financial statements are also shown here. Answer the following questions. (Note: Industry average ratios are provided in Ch03 P15 Build a Model.xlsx.) a. Has J&W's liquidity position improved or worsened? Explain. b. Has J&W's ability to manage its assets...
My question is how to solve the answers for the yellow blocks? Is there any possible...
 My question is how to solve the answers for the yellow blocks?
Is there any possible way I could get some help with this
question.
AutoSave OFF Unit 2 Ratio Data Home Insert Draw Page Layout Formulas Data Review View Tell me e Share O Comments X Arial 10 AA General Σν Comments HH 23 Insert Delete y Paste B I AY Y % Ideas Conditional Format Formatting as Table Cell Styles Format Sort & Filter Find & Select v...
My question is how to solve the answers for the yellow blocks?
Is there any possible way I could get some help with this
question.
AutoSave OFF Unit 2 Ratio Data Home Insert Draw Page Layout Formulas Data Review View Tell me e Share O Comments X Arial 10 AA General Σν Comments HH 23 Insert Delete y Paste B I AY Y % Ideas Conditional Format Formatting as Table Cell Styles Format Sort & Filter Find & Select v...
Need Help filling in all yellow blocks. Thank you in advance! 2 Joshua & White Technologies:...
 Need Help filling in all yellow blocks. Thank you in
advance!
2 Joshua & White Technologies: December 31 Balance Sheets 3 Thousands of Dollars) 2016 21,000 3,759 52,500 Assets 6 Cash and cash equivalents Short-term investments 8 Accounts Receivable g Inventories 10 Total current assets 11 Net fixed assets 12 Total assets 2015 20,000 3,240 48,000 84000 56.000 $161,259 $127,240 218400 200,000 $379,659 $327 240 4 Liabilities and equity 15 Accounts payable 16 Accruals 17 Notes payable 18 Total current...
Need Help filling in all yellow blocks. Thank you in
advance!
2 Joshua & White Technologies: December 31 Balance Sheets 3 Thousands of Dollars) 2016 21,000 3,759 52,500 Assets 6 Cash and cash equivalents Short-term investments 8 Accounts Receivable g Inventories 10 Total current assets 11 Net fixed assets 12 Total assets 2015 20,000 3,240 48,000 84000 56.000 $161,259 $127,240 218400 200,000 $379,659 $327 240 4 Liabilities and equity 15 Accounts payable 16 Accruals 17 Notes payable 18 Total current...
What would be my answer for the liquidity ratios The first blue box? hes385r3_Financial_Performance_Worksheet_Week_4 Review View...
 What would be my answer for the liquidity ratios The first blue
box?
hes385r3_Financial_Performance_Worksheet_Week_4 Review View AutoSave OFF A S Home Insert DrawPage Layout Times New Roman 12 Paste BIV A B4 X v fx BALANCE SHEET Comments Formulas A A Q-Search Sheet Share EAY- O 4 Data = = 2 Wrap Text Merge & Center General $ % 3 E 48 2X Delete Format Sort & Filter Find A Select ideas Sensitivity Formatting as Table X Styles Hillside, Inc....
What would be my answer for the liquidity ratios The first blue
box?
hes385r3_Financial_Performance_Worksheet_Week_4 Review View AutoSave OFF A S Home Insert DrawPage Layout Times New Roman 12 Paste BIV A B4 X v fx BALANCE SHEET Comments Formulas A A Q-Search Sheet Share EAY- O 4 Data = = 2 Wrap Text Merge & Center General $ % 3 E 48 2X Delete Format Sort & Filter Find A Select ideas Sensitivity Formatting as Table X Styles Hillside, Inc....
Blooper’s analysts have come up with the following revised estimates for its magnoosium mine: Range Pessimistic...
 Blooper’s analysts have come up with the following revised
estimates for its magnoosium mine:
Range
Pessimistic
Optimistic
Initial investment
+
30
%
–
25
%
Revenues
–
25
%
+
20
%
Variable costs
+
25
%
–
15
%
Fixed cost
+
50
%
–
50
%
Working capital
+
30
%
–
45
%
Conduct a sensitivity analysis for each variable and range and
compute the NPV for each. Use Spreadsheet 10.1 and accompanying
data as a starting...
Blooper’s analysts have come up with the following revised
estimates for its magnoosium mine:
Range
Pessimistic
Optimistic
Initial investment
+
30
%
–
25
%
Revenues
–
25
%
+
20
%
Variable costs
+
25
%
–
15
%
Fixed cost
+
50
%
–
50
%
Working capital
+
30
%
–
45
%
Conduct a sensitivity analysis for each variable and range and
compute the NPV for each. Use Spreadsheet 10.1 and accompanying
data as a starting...
You have just been hired as a financial analyst for Lydex Company, a manufacturer of safety helmets. Your boss has asked...
You have just been hired as a financial analyst for Lydex Company, a manufacturer of safety helmets. Your boss has asked you to perform a comprehensive analysis of the company’s financial statements, including comparing Lydex’s performance to its major competitors. The company’s financial statements for the last two years are as follows: Lydex Company Comparative Balance Sheet This Year Last Year Assets Current assets: Cash $ 980,000 $ 1,220,000 Marketable securities 0 300,000 Accounts receivable, net 2,780,000 1,880,000 Inventory 3,620,000...
COMPLETE THE FOLLOWING USING THE ATTACHED DOCUMENTS In this exercise, you will perform a financial statement...
 COMPLETE THE FOLLOWING USING THE ATTACHED DOCUMENTS
In this exercise, you will perform a financial statement analysis for Water Feature Designers Inc. You will perform horizontal/vertical analyses and create charts to highlight key information from these analyses. You will also calculate financial ratios and insert cell comments. Use this information to complete the ratio analysis. Ratio Current Ratio Debt-to-Equity Ratio Profit Margin 2016 7.62 0.17 .186 2015 3.45 0.28 292 2014 8.21 0.18 255 1. Open EA9-A2-FSA from your Chapter...
COMPLETE THE FOLLOWING USING THE ATTACHED DOCUMENTS
In this exercise, you will perform a financial statement analysis for Water Feature Designers Inc. You will perform horizontal/vertical analyses and create charts to highlight key information from these analyses. You will also calculate financial ratios and insert cell comments. Use this information to complete the ratio analysis. Ratio Current Ratio Debt-to-Equity Ratio Profit Margin 2016 7.62 0.17 .186 2015 3.45 0.28 292 2014 8.21 0.18 255 1. Open EA9-A2-FSA from your Chapter...
 Consider the following scenario: Your boss has come to you for
advice on the current finances of the company and needs you to
create an extended DuPont analysis, common size analysis, and
percentage change analysis. Your boss wants you to fill out the
attached Excel file because he/she has no idea what she is talking
about and is going to use your report as her work. Remember to
answer all the questions in the attached document. Has J&W's
liquidity position...
Consider the following scenario: Your boss has come to you for
advice on the current finances of the company and needs you to
create an extended DuPont analysis, common size analysis, and
percentage change analysis. Your boss wants you to fill out the
attached Excel file because he/she has no idea what she is talking
about and is going to use your report as her work. Remember to
answer all the questions in the attached document. Has J&W's
liquidity position...
 Your boss is back. This time he/she provides you a partial model
to a bond valuation. This bond is a 20-year, 8% semiannual coupon
bond with a par value of $1,000 may be called in 5 years at a call
price of $1,040. The bond sells for $1,100. (Assume that the bond
has been issued.) She needs you to complete the partial model for
her. She needs the following to be answered.
What is the bond's yield to maturity?
What...
Your boss is back. This time he/she provides you a partial model
to a bond valuation. This bond is a 20-year, 8% semiannual coupon
bond with a par value of $1,000 may be called in 5 years at a call
price of $1,040. The bond sells for $1,100. (Assume that the bond
has been issued.) She needs you to complete the partial model for
her. She needs the following to be answered.
What is the bond's yield to maturity?
What...
 Notes Based on year-end balance sheet figures. Calculation is based on a 365-day year. SPREADSHEET PROBLEM (3-15) Analysis Start with the partial model in the file Ch03 P15 Build a Model.XIS From the textDOORS Web site. Joshua & White (J&W) Technology's financial statements are also shown here. Answer the following questions. (Note: Industry average ratios are provided in Ch03 P15 Build a Model.xlsx.) a. Has J&W's liquidity position improved or worsened? Explain. b. Has J&W's ability to manage its assets...
 My question is how to solve the answers for the yellow blocks?
Is there any possible way I could get some help with this
question.
AutoSave OFF Unit 2 Ratio Data Home Insert Draw Page Layout Formulas Data Review View Tell me e Share O Comments X Arial 10 AA General Σν Comments HH 23 Insert Delete y Paste B I AY Y % Ideas Conditional Format Formatting as Table Cell Styles Format Sort & Filter Find & Select v...
My question is how to solve the answers for the yellow blocks?
Is there any possible way I could get some help with this
question.
AutoSave OFF Unit 2 Ratio Data Home Insert Draw Page Layout Formulas Data Review View Tell me e Share O Comments X Arial 10 AA General Σν Comments HH 23 Insert Delete y Paste B I AY Y % Ideas Conditional Format Formatting as Table Cell Styles Format Sort & Filter Find & Select v...
 Need Help filling in all yellow blocks. Thank you in
advance!
2 Joshua & White Technologies: December 31 Balance Sheets 3 Thousands of Dollars) 2016 21,000 3,759 52,500 Assets 6 Cash and cash equivalents Short-term investments 8 Accounts Receivable g Inventories 10 Total current assets 11 Net fixed assets 12 Total assets 2015 20,000 3,240 48,000 84000 56.000 $161,259 $127,240 218400 200,000 $379,659 $327 240 4 Liabilities and equity 15 Accounts payable 16 Accruals 17 Notes payable 18 Total current...
Need Help filling in all yellow blocks. Thank you in
advance!
2 Joshua & White Technologies: December 31 Balance Sheets 3 Thousands of Dollars) 2016 21,000 3,759 52,500 Assets 6 Cash and cash equivalents Short-term investments 8 Accounts Receivable g Inventories 10 Total current assets 11 Net fixed assets 12 Total assets 2015 20,000 3,240 48,000 84000 56.000 $161,259 $127,240 218400 200,000 $379,659 $327 240 4 Liabilities and equity 15 Accounts payable 16 Accruals 17 Notes payable 18 Total current...
 What would be my answer for the liquidity ratios The first blue
box?
hes385r3_Financial_Performance_Worksheet_Week_4 Review View AutoSave OFF A S Home Insert DrawPage Layout Times New Roman 12 Paste BIV A B4 X v fx BALANCE SHEET Comments Formulas A A Q-Search Sheet Share EAY- O 4 Data = = 2 Wrap Text Merge & Center General $ % 3 E 48 2X Delete Format Sort & Filter Find A Select ideas Sensitivity Formatting as Table X Styles Hillside, Inc....
What would be my answer for the liquidity ratios The first blue
box?
hes385r3_Financial_Performance_Worksheet_Week_4 Review View AutoSave OFF A S Home Insert DrawPage Layout Times New Roman 12 Paste BIV A B4 X v fx BALANCE SHEET Comments Formulas A A Q-Search Sheet Share EAY- O 4 Data = = 2 Wrap Text Merge & Center General $ % 3 E 48 2X Delete Format Sort & Filter Find A Select ideas Sensitivity Formatting as Table X Styles Hillside, Inc....
 Blooper’s analysts have come up with the following revised
estimates for its magnoosium mine:
Range
Pessimistic
Optimistic
Initial investment
+
30
%
–
25
%
Revenues
–
25
%
+
20
%
Variable costs
+
25
%
–
15
%
Fixed cost
+
50
%
–
50
%
Working capital
+
30
%
–
45
%
Conduct a sensitivity analysis for each variable and range and
compute the NPV for each. Use Spreadsheet 10.1 and accompanying
data as a starting...
Blooper’s analysts have come up with the following revised
estimates for its magnoosium mine:
Range
Pessimistic
Optimistic
Initial investment
+
30
%
–
25
%
Revenues
–
25
%
+
20
%
Variable costs
+
25
%
–
15
%
Fixed cost
+
50
%
–
50
%
Working capital
+
30
%
–
45
%
Conduct a sensitivity analysis for each variable and range and
compute the NPV for each. Use Spreadsheet 10.1 and accompanying
data as a starting...
 COMPLETE THE FOLLOWING USING THE ATTACHED DOCUMENTS
In this exercise, you will perform a financial statement analysis for Water Feature Designers Inc. You will perform horizontal/vertical analyses and create charts to highlight key information from these analyses. You will also calculate financial ratios and insert cell comments. Use this information to complete the ratio analysis. Ratio Current Ratio Debt-to-Equity Ratio Profit Margin 2016 7.62 0.17 .186 2015 3.45 0.28 292 2014 8.21 0.18 255 1. Open EA9-A2-FSA from your Chapter...
COMPLETE THE FOLLOWING USING THE ATTACHED DOCUMENTS
In this exercise, you will perform a financial statement analysis for Water Feature Designers Inc. You will perform horizontal/vertical analyses and create charts to highlight key information from these analyses. You will also calculate financial ratios and insert cell comments. Use this information to complete the ratio analysis. Ratio Current Ratio Debt-to-Equity Ratio Profit Margin 2016 7.62 0.17 .186 2015 3.45 0.28 292 2014 8.21 0.18 255 1. Open EA9-A2-FSA from your Chapter...
Most questions answered within 3 hours.
-
A biologist wishes to estimate the effect of an antibiotic on
the growth of a particular...
asked 59 seconds from now -
O’Deesha Company has the following information available:
Quality engineering of
products
$20,000
Quality training of
employees &n
asked 6 minutes ago -
a) Draw two water molecules.
b) Clearly name and label the type of bond that exists...
asked 1 hour ago -
C - Language
Write a loop that sets each array element to the sum of itself...
asked 2 hours ago -
(63
#14)
which of the following statments best describes how chamging
the concentration of the substances...
asked 5 hours ago -
In the following reaction, which element is undergoing
oxidation: Na2SO3 + N2O --> N2 + Na2SO4...
asked 6 hours ago -
Which of the following pairs of ions have the same electron
configuration?
I: Br− and Se2−...
asked 9 hours ago -
The Foremost Composite Materials Company is planning a two-day
sales conference for October 19-20. The conference...
asked 9 hours ago -
3) Illustrate the observed pattern of relatedness of organisms
versus adaptations to specific conditions. This means...
asked 10 hours ago -
In winter a lake has a 0.35 m thick ice layer over 1.10 m of
water....
asked 10 hours ago -
Assuming the following has been encrypted with a Vigenere cipher
below, use the method(s) and assumptions...
asked 11 hours ago -
How would I use switch statements to write a program that will
take an input of...
asked 11 hours ago