Consider the following annual returns of Estee Lauder and Lowe’s Companies: Estee Lauder Lowe’s Companies Year...
Consider the following annual returns of Estee Lauder and Lowe’s Companies:
| Estee Lauder | Lowe’s Companies | ||||||
| Year 1 | 25.3 | % | −7.0 | % | |||
| Year 2 | − | 38.0 | 18.0 | ||||
| Year 3 | 19.5 | 6.1 | |||||
| Year 4 | 51.8 | 58.0 | |||||
| Year 5 | − | 18.7 | −28.0 | ||||
Compute each stock’s average return, standard deviation, and
coefficient of variation. (Round your answers to 2 decimal
places.)
| Estee Lauder | Lowe's Companies | |
| Average return | % | % |
| Standard deviation | % | % |
| Coefficient of variation |
Which stock appears better?
1. Estee Lauder
2. Lowe’s Companies
Please answer all the parts correctly. Thank You!
Homework Answers
*Please rate thumbs up
Add Answer to:
Consider the following annual returns of Estee Lauder and Lowe’s Companies: Estee Lauder Lowe’s Companies Year...
14 Problem 9-33 Risk, Return, and Their Relationship (LG9-3, LG9-4) Consider the following annual returns of...
 14 Problem 9-33 Risk, Return, and Their Relationship (LG9-3, LG9-4) Consider the following annual returns of Estee Lauder and Lowe's Companies Estee Lowe's LauderCompanies Year 1 Year 2 Year 3 Year 4 Year 5 24.3% -28.0 18.5 50.8 -3.0% 17.0 5.1 48.0 Book -18.0 Hint ute each stock's average return, standard deviation, and coefficient of variation, (Round your answers to 2 decimal places.) Print Estee Lauder Lowe's Companies Average retun Standard deviation Coefficient of variation rences Which stock appears better?...
Consider the following annual returns of Estée Lauder and Lowe's Companies: Year 1 Year 2 Year...
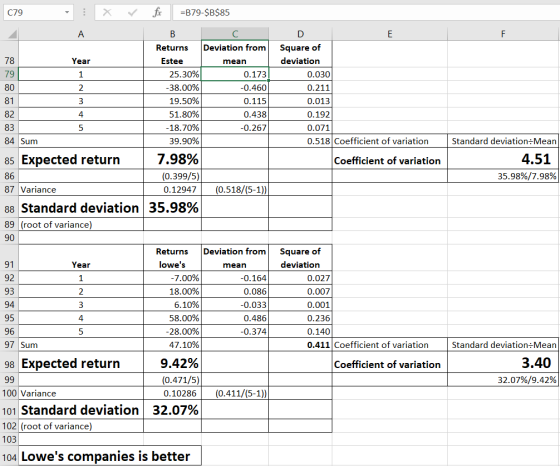
 Consider the following annual returns of Estée Lauder and Lowe's Companies: Year 1 Year 2 Year 3 Estée Lauder 23.48 -26.0 17.6 49.9 -16.8 Lowe's Companies -6.0% 16.1 4.2 48.0 -19.0 Year 5 Compute each stock's average return, standard deviation, and coefficient of variation. (Round your answers to 2 decimal places.) Estée Lauder Lowe's Companies % Average return Standard deviation Coefficient of variation s Which stock appears better? Lowe's Companies Estée Lauder
Rank the following three stocks by their risk-return relationship, best to worst. Rail Haul has an...
 Rank the following three stocks by their risk-return relationship, best to worst. Rail Haul has an average return of 14 percent and standard deviation of 36 percent. The average return and standard deviation of Idol Staff are 17 percent and 32 percent; and of Poker R-Us are 11 percent and 30 percent. Rank Stock Table 9.2 Average Returns for Bonds T-Billa 2.66 1950 to 1959 Average 1960 to 1969 Average 1970 to 1979 Average 1980 to 1989 Average 1990 to...
Problem 9-33 Risk, Return, and Their Relationship (LG9-3, LG9-4) Consider the following annual returns of Estée...
 Problem 9-33 Risk, Return, and Their Relationship (LG9-3, LG9-4) Consider the following annual returns of Estée Lauder and Lowe's Companies: Year 1 Year 2 Year 3 Year 4 Year 5 Estée Lauder 23.48 -26.0 17.6 49.9 -16.8 Lowe's Companies -6.08 16.1 4.2 48.0 - 19.0 Compute each stock's average return, standard deviation, and coefficient of variation (Round your answers to 2 decimal places.) Estée Lauder Lowe's Companies Average return Standard deviation Coefficient of variation Which stock appears better? Rank the...
Consider the following annual returns of Molson Coors and International Paper: Year 1 Year 2 Year...
 Consider the following annual returns of Molson Coors and International Paper: Year 1 Year 2 Year 3 Year 4 Year 5 Molson Coors 17.8% - 8.7 38.0 - 7.5 16.5 International Paper 4.8% -17.8 -0.5 26.9 -11.4 Compute each stock's average return, standard deviation, and coefficient of variation. (Round your answers to 2 Molson Coors 11.22 % International Paper Average return ſ Standard deviation Coefficient of variation
Consider the following annual returns of Molson Coors and International Paper: Year 1 Year 2 Year...
 Consider the following annual returns of Molson Coors and International Paper: Year 1 Year 2 Year 3 Year 4 Year 5 Molson Coors 25.8% -10.3 46.0 -10.7 18.1 International Paper 6.4% -19.4 -0.4 28.5 -13.0 Compute each stock's average return, standard deviation, and coefficient of variation. (Round your answers to 2 decimal places.) Molson Coors International Paper Average return Standard deviation Coefficient of variation Which stock appears better? International Paper Molson Coors
Consider the following annual returns of Molson Coors and International Paper: Year 1 Year 2 Year...
 Consider the following annual returns of Molson Coors and International Paper: Year 1 Year 2 Year 3 Year 4 Year 5 Molson Coors 24.3% -10.0 44.5 -10.1 17.8 International Paper 6.13 -19.1 -0.9 28.2 -12.7 Compute each stock's average return, standard deviation, and coefficient of variation. (Round your answers to 2 decimal places.) Molson Coors 13.30 % International Paper 0.32 % Average return Standard deviation Coefficient of variation Which stock appears better? International Paper Molson Coors
Consider the following annual returns of Molson Coors and International Paper: International Paper Molson Coors 18.35...
 Consider the following annual returns of Molson Coors and International Paper: International Paper Molson Coors 18.35 - 8.8 38.5 - 7.7 16.6 Year 1 Year 2 Year 3 Year 4 Year 5 -17.9 27.0 -11.5 Compute each stock's average return, standard deviation, and coefficient of variation (Round your answers to 2 decimal places.) Molson Coors International Paper Average return Standard deviation Coefficient of variation Which stock appears better? International Paper Molson Coors
ezto.mhe Homewo Assi 2018FS FINANC 3000 Hegger-Corporate F 10. 1.50 points value: Consider the following annual...
 ezto.mhe Homewo Assi 2018FS FINANC 3000 Hegger-Corporate F 10. 1.50 points value: Consider the following annual returns of Molson Coors and International Pa per: Year 1 Year 2-8.9 Year 3 Year 4-7.9 Year 5 16.7 18.8% 5.0% -18.0 -0.7 27.1 39.0 Compute each stocks average retun, standard deviation, and coficient of variation. (Round your answers to 2 decimal places.) Molson CoorsInternational Paper 036 % 11.54 % Average return Standard deviation Coefficient of variation Which stock appears better? O Molson Coors...
 14 Problem 9-33 Risk, Return, and Their Relationship (LG9-3, LG9-4) Consider the following annual returns of Estee Lauder and Lowe's Companies Estee Lowe's LauderCompanies Year 1 Year 2 Year 3 Year 4 Year 5 24.3% -28.0 18.5 50.8 -3.0% 17.0 5.1 48.0 Book -18.0 Hint ute each stock's average return, standard deviation, and coefficient of variation, (Round your answers to 2 decimal places.) Print Estee Lauder Lowe's Companies Average retun Standard deviation Coefficient of variation rences Which stock appears better?...
 Consider the following annual returns of Estée Lauder and Lowe's Companies: Year 1 Year 2 Year 3 Estée Lauder 23.48 -26.0 17.6 49.9 -16.8 Lowe's Companies -6.0% 16.1 4.2 48.0 -19.0 Year 5 Compute each stock's average return, standard deviation, and coefficient of variation. (Round your answers to 2 decimal places.) Estée Lauder Lowe's Companies % Average return Standard deviation Coefficient of variation s Which stock appears better? Lowe's Companies Estée Lauder
 Rank the following three stocks by their risk-return relationship, best to worst. Rail Haul has an average return of 14 percent and standard deviation of 36 percent. The average return and standard deviation of Idol Staff are 17 percent and 32 percent; and of Poker R-Us are 11 percent and 30 percent. Rank Stock Table 9.2 Average Returns for Bonds T-Billa 2.66 1950 to 1959 Average 1960 to 1969 Average 1970 to 1979 Average 1980 to 1989 Average 1990 to...
 Problem 9-33 Risk, Return, and Their Relationship (LG9-3, LG9-4) Consider the following annual returns of Estée Lauder and Lowe's Companies: Year 1 Year 2 Year 3 Year 4 Year 5 Estée Lauder 23.48 -26.0 17.6 49.9 -16.8 Lowe's Companies -6.08 16.1 4.2 48.0 - 19.0 Compute each stock's average return, standard deviation, and coefficient of variation (Round your answers to 2 decimal places.) Estée Lauder Lowe's Companies Average return Standard deviation Coefficient of variation Which stock appears better? Rank the...
 Consider the following annual returns of Molson Coors and International Paper: Year 1 Year 2 Year 3 Year 4 Year 5 Molson Coors 17.8% - 8.7 38.0 - 7.5 16.5 International Paper 4.8% -17.8 -0.5 26.9 -11.4 Compute each stock's average return, standard deviation, and coefficient of variation. (Round your answers to 2 Molson Coors 11.22 % International Paper Average return ſ Standard deviation Coefficient of variation
 Consider the following annual returns of Molson Coors and International Paper: Year 1 Year 2 Year 3 Year 4 Year 5 Molson Coors 25.8% -10.3 46.0 -10.7 18.1 International Paper 6.4% -19.4 -0.4 28.5 -13.0 Compute each stock's average return, standard deviation, and coefficient of variation. (Round your answers to 2 decimal places.) Molson Coors International Paper Average return Standard deviation Coefficient of variation Which stock appears better? International Paper Molson Coors
 Consider the following annual returns of Molson Coors and International Paper: Year 1 Year 2 Year 3 Year 4 Year 5 Molson Coors 25.8% -10.3 46.0 -10.7 18.1 International Paper 6.4% -19.4 -0.4 28.5 -13.0 Compute each stock's average return, standard deviation, and coefficient of variation. (Round your answers to 2 decimal places.) Molson Coors International Paper Average return Standard deviation Coefficient of variation Which stock appears better? International Paper Molson Coors
 Consider the following annual returns of Molson Coors and International Paper: Year 1 Year 2 Year 3 Year 4 Year 5 Molson Coors 24.3% -10.0 44.5 -10.1 17.8 International Paper 6.13 -19.1 -0.9 28.2 -12.7 Compute each stock's average return, standard deviation, and coefficient of variation. (Round your answers to 2 decimal places.) Molson Coors 13.30 % International Paper 0.32 % Average return Standard deviation Coefficient of variation Which stock appears better? International Paper Molson Coors
 Consider the following annual returns of Molson Coors and International Paper: International Paper Molson Coors 18.35 - 8.8 38.5 - 7.7 16.6 Year 1 Year 2 Year 3 Year 4 Year 5 -17.9 27.0 -11.5 Compute each stock's average return, standard deviation, and coefficient of variation (Round your answers to 2 decimal places.) Molson Coors International Paper Average return Standard deviation Coefficient of variation Which stock appears better? International Paper Molson Coors
 ezto.mhe Homewo Assi 2018FS FINANC 3000 Hegger-Corporate F 10. 1.50 points value: Consider the following annual returns of Molson Coors and International Pa per: Year 1 Year 2-8.9 Year 3 Year 4-7.9 Year 5 16.7 18.8% 5.0% -18.0 -0.7 27.1 39.0 Compute each stocks average retun, standard deviation, and coficient of variation. (Round your answers to 2 decimal places.) Molson CoorsInternational Paper 036 % 11.54 % Average return Standard deviation Coefficient of variation Which stock appears better? O Molson Coors...
Most questions answered within 3 hours.
-
Required information
[The following information applies to the questions
displayed below.]
Satellite Systems modified its model...
asked 2 minutes ago -
When one molecule of methane combusts with oxygen, 5.74 X
10-21 J is released as heat....
asked 8 minutes ago -
High Normal blood pressure is categorized as which of
the following?
140-159/90-99
120/80
130-139/85-89
160/100
asked 11 minutes ago -
Please I need help with MATLAB .. PLease help me . Thankyou
Write Matlab code to...
asked 9 minutes ago -
You are saving towards purchasing a house and currently have
$20,000 in an account that earns...
asked 19 minutes ago -
Draw three resonance structures for each of
the following:
(a) -CH2NO2 (b) CH3CO2CH3
(c) -CH2CO2- (d)...
asked 26 minutes ago -
There has been discussion about people moving from Earth to Mars
in the future. An organization...
asked 25 minutes ago -
Starting Out with c++ Student Line Up Using Files A teacher has
asked all her students...
asked 26 minutes ago -
Two point charges totaling 9.00 µC exert a repulsive force of
0.200 N on one another...
asked 28 minutes ago -
In Visual Studio 2017
Populate a two-dimensional array with the following prices in
this table order:...
asked 37 minutes ago -
Answer below in detail
1. Reverse Logistics - Introduction
2. The world before and after reverse...
asked 43 minutes ago -
Find the area of the shaded region. The graph to the right
depicts IQ scores of...
asked 54 minutes ago