Research further into the following companies using the school research databases, such as Hoovers database, or...
Research further into the following companies using the school research databases, such as Hoovers database, or the company’s own website.
Yum! Brands, Inc.
Sales/Revenue: $5.88B
Gross profit: $2.69B
Net income: $1.34B
Panera Bread
Sales/Revenue: $2,8B
Gross profit: $949.57M
Net income: $145.57M
Starbucks
Sales/Revenue: 22.38B
Gross profit: 5.34B
Net income: 2.88B
Answer the following: Are there any discontinued operations? If yes, what figures are reported? Write a short paper clearly identifying each of the required numbers and your explanation.
Homework Answers
As per the school research database, I have prepared the below table with the given information.
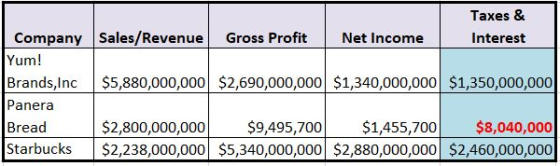
After observing the table, the company Panera Bread is really losing more taxes and there is a lot of variance in sales/revenue and gross profit.
If we observed the other two companies are Yum! Brands, Inc and Starbucks are losing half of the taxes & interest in between the variance of net income and gross profit.
So, as per the output of the above table, the Panera Bread is better to discontinue the operations due to the large variance of the amount went through taxes & interest $8,040,000 compared to net income of $1,455,700.
Add Answer to:
Research further into the following companies using the school research databases, such as Hoovers database, or...
Research further into the following companies using the school research databases, such as Hoovers database, or...
Research further into the following companies using the school research databases, such as Hoovers database, or the company’s own website. Yum! Brands, Inc. Sales/Revenue: $5.88B Gross profit: $2.69B Net income: $1.34B Panera Bread Sales/Revenue: $2,8B Gross profit: $949.57M Net income: $145.57M Starbucks Sales/Revenue: 22.38B Gross profit: 5.34B Net income: 2.88B Answer the following: Are there any discontinued operations? If yes, what figures are reported? Write a short paper clearly identifying each of the required numbers and your explanation.
Research further into the following companies using the school research databases, such as Hoovers database, or...
Research further into the following companies using the school research databases, such as Hoovers database, or the company’s own website. Yum! Brands, Inc. Panera Bread Starbucks Using the current year, locate each company’s total assets, total liabilities, and owner’s equity. Identify each company’s inventory method. Write your findings, clearly identifying each of the required numbers.
Complete a common size income statement (vertical analysis) for each of the following companies Yum! Brands,...
 Complete a common size income statement (vertical analysis) for each of the following companies Yum! Brands, Inc Panera Bread Starbucks The common size income statement is for the three most recent years using the following information Complete the assignment using Excel (show formulas please) Yum! Brands, Inc. IN BILLIONS Net sales Gross profit Net income 2015 6.44B 3.44B 1.29B 2016 6.36B 2.67B 1.64B 2017 5.88B 2.69B 1.34B Panera bread IN MILLIONS Net sales Gross profit Net income 2015 691.77M 69.88M...
INVENTORY RESEARCH EXERCISE Examine the annual report (form 10-K) of one of the following companies and...
INVENTORY RESEARCH EXERCISE Examine the annual report (form 10-K) of one of the following companies and answer the following five questions. Highlight the company you selected. Use the space below each question to complete your answer. Big Lots, Inc. Burlington Stores, Inc. Dollar General Corp. Target Corp. Wal-Mart Stores, Inc. You may find the information by going to the company’s website and selecting the link for “Investor Relations.” Look for Annual Reports or Form 10-K. You may also go to...
Using the following list of items, fill in the blanks for where the item belongs on...
 Using the following list of items, fill in the blanks for where the item belongs on a multiple-step income statement. Use the Condensed Multiple-Step Income Statement format. You only need earnings per share for net income (don't need to separate out income from continuing operations or discontinued operations). Selling expenses, Cost of goods sold, Net sales, Income tax expense, Gross profit, Income from operations, Administrative expenses, Income before taxes, Discontinued operations, Other revenues and gains, Other expenses and losses, Income...
Using the following information (below) complete the Income Statement. Discontinued operations Loss from operations of discontinued...
 Using the following information (below) complete the Income Statement. Discontinued operations Loss from operations of discontinued plastics division Gain from disposal of plastics division Pre-Tax $ (450,000) $1,150,000 Note: Common Shares Outstanding: 1,000,000 Note: Tax Expense Rate is 35% Company Name Income Statement For the Year Ended December 31, 2017 $ 10,565,100 Sales revenue Sales discounts Sales returns and allowances Net Sales COGS Gross Profit $ 10,565,100 6,250,000 $ 4,315, 100 Selling & Administrative Selling expenses Administrative expenses 650,000 257,000...
Consider the following partially completed income statements for merchandising companies and compute the missing amounts: (Click...
 Consider the following partially completed income statements for merchandising companies and compute the missing amounts: (Click the icon to view the Income Statements.) Data Table Fit Apparel Laura's Bakery $ 99,000 Fit Apparel Laura's Bakery 99,000 32,000 $ (d) 48,000 Net Sales Revenue Cost of Goods Sold: Beginning Merchandise Inventory Purchases and Freight In Cost of Goods Available for Sale Ending Merchandise Inventory Cost of Goods Sold Gross Profit Selling and Administrative Expenses Net Sales Revenue Cost of Goods Sold:...
Consider the following partially completed income statements for merchandising companies and compute the missing amounts: (Click...
 Consider the following partially completed income statements for merchandising companies and compute the missing amounts: (Click the icon to view the Income Statements.) Data Table Flynt Corp. Corrigan, Inc. 100,000 L $ L $ 28,000 Flynt Corp. 100,000 Corrigan, Inc. $ 51,000 $ Net Sales Revenue Cost of Goods Sold: Beginning Merchandise Inventory Purchases and Freight In Cost of Goods Available for Sale Ending Merchandise Inventory Cost of Goods Sold Gross Profit Selling and Administrative Expenses 93,000 (1,800) Net Sales...
Consider the following partially completed income statements for merchandising companies and compute the missing amounts: E:...
 Consider the following partially completed income statements for merchandising companies and compute the missing amounts: E: (Click the icon to view the Income Statements.) i Data Table Snyder Corp. Jones, Inc. 100,000 $ Jones, Inc. 100,000 Snyder Corp. $ 29,000 $ (d) 52,000 Net Sales Revenue Cost of Goods Sold: Beginning Merchandise Inventory Purchases and Freight In Cost of Goods Available for Sale Ending Merchandise Inventory Cost of Goods Sold Gross Profit Selling and Administrative Expenses Net Sales Revenue Cost...
Take a look a this companies projected profit and loss. Analyze and describe the health of the company. 2020 2021 2022 Revenue $681,720 $1,940,280 $3,198,790 Direct Costs...
Take a look a this companies projected profit and loss. Analyze and describe the health of the company. 2020 2021 2022 Revenue $681,720 $1,940,280 $3,198,790 Direct Costs Gross Margin $681,720 $1,940,280 $3,198,790 Gross Margin % 100% 100% 100% Operating Expenses Salaries & Wages $288,000 $293,760 $299,636 Employee Related Expenses $57,600 $58,752 $59,927 Buffalo Hospital Supply $60,000 $60,000 $60,000 Fountain Plaza Furnished Office including Utilities Rental ($750 ea. for two office spaces) $18,000 $18,000 $18,000 Research and Development $24,000 $24,000 $24,000...
 Complete a common size income statement (vertical analysis) for each of the following companies Yum! Brands, Inc Panera Bread Starbucks The common size income statement is for the three most recent years using the following information Complete the assignment using Excel (show formulas please) Yum! Brands, Inc. IN BILLIONS Net sales Gross profit Net income 2015 6.44B 3.44B 1.29B 2016 6.36B 2.67B 1.64B 2017 5.88B 2.69B 1.34B Panera bread IN MILLIONS Net sales Gross profit Net income 2015 691.77M 69.88M...
 Using the following list of items, fill in the blanks for where the item belongs on a multiple-step income statement. Use the Condensed Multiple-Step Income Statement format. You only need earnings per share for net income (don't need to separate out income from continuing operations or discontinued operations). Selling expenses, Cost of goods sold, Net sales, Income tax expense, Gross profit, Income from operations, Administrative expenses, Income before taxes, Discontinued operations, Other revenues and gains, Other expenses and losses, Income...
 Using the following information (below) complete the Income Statement. Discontinued operations Loss from operations of discontinued plastics division Gain from disposal of plastics division Pre-Tax $ (450,000) $1,150,000 Note: Common Shares Outstanding: 1,000,000 Note: Tax Expense Rate is 35% Company Name Income Statement For the Year Ended December 31, 2017 $ 10,565,100 Sales revenue Sales discounts Sales returns and allowances Net Sales COGS Gross Profit $ 10,565,100 6,250,000 $ 4,315, 100 Selling & Administrative Selling expenses Administrative expenses 650,000 257,000...
 Consider the following partially completed income statements for merchandising companies and compute the missing amounts: (Click the icon to view the Income Statements.) Data Table Fit Apparel Laura's Bakery $ 99,000 Fit Apparel Laura's Bakery 99,000 32,000 $ (d) 48,000 Net Sales Revenue Cost of Goods Sold: Beginning Merchandise Inventory Purchases and Freight In Cost of Goods Available for Sale Ending Merchandise Inventory Cost of Goods Sold Gross Profit Selling and Administrative Expenses Net Sales Revenue Cost of Goods Sold:...
 Consider the following partially completed income statements for merchandising companies and compute the missing amounts: (Click the icon to view the Income Statements.) Data Table Flynt Corp. Corrigan, Inc. 100,000 L $ L $ 28,000 Flynt Corp. 100,000 Corrigan, Inc. $ 51,000 $ Net Sales Revenue Cost of Goods Sold: Beginning Merchandise Inventory Purchases and Freight In Cost of Goods Available for Sale Ending Merchandise Inventory Cost of Goods Sold Gross Profit Selling and Administrative Expenses 93,000 (1,800) Net Sales...
 Consider the following partially completed income statements for merchandising companies and compute the missing amounts: E: (Click the icon to view the Income Statements.) i Data Table Snyder Corp. Jones, Inc. 100,000 $ Jones, Inc. 100,000 Snyder Corp. $ 29,000 $ (d) 52,000 Net Sales Revenue Cost of Goods Sold: Beginning Merchandise Inventory Purchases and Freight In Cost of Goods Available for Sale Ending Merchandise Inventory Cost of Goods Sold Gross Profit Selling and Administrative Expenses Net Sales Revenue Cost...
Most questions answered within 3 hours.
-
Assume one of your finals has 50 questions on it, and
lucky for you, it's all...
asked 26 minutes ago -
Rice Products in Bangladesh
Business behavior is derived in large part from the basic cultural
environment...
asked 1 hour ago -
The following base sequence is found for a mRNA fragment from
wild-type E. coli: 5'- UAUCAGUAGAUAAUGUAACC-3'...
asked 2 hours ago -
For this exercise, round all regression parameters to three
decimal places.
One of the two tables...
asked 2 hours ago -
What is the 5% level of significance for mean = 3.60, standard
deviation = 0.94, and...
asked 2 hours ago -
Prior to beginning work on this discussion, please read the
article by Hayley Peterson, 15 Companies...
asked 3 hours ago -
Which pair of aqueous solutions, when mixed, will form a
precipitate?
A) NaNO3 and AgC2H3O2
B)...
asked 3 hours ago -
1-Write an algorithm to get two numbers from the user (as
inputs) and calculate the sum...
asked 6 hours ago -
Define white-collar crime. What is the difference between
offender and offense-based definitions of white-collar crime? What...
asked 7 hours ago -
Consider a reaction which is 1st order with respect to A and 1st
order with respect...
asked 7 hours ago -
c++
The length of the hypotenuse of a right-angled triangle is the
square root of the...
asked 7 hours ago -
When a metal rod is heated, not only its resistance but also its
length and cross‐sectional...
asked 7 hours ago