Pick one of these and answer it. (If you pick both, no points for you!) (10...
Pick one of these and answer it. (If you pick both, no points for you!)
- (10 points) Make a graph to show the trends in Labor Force Participation rate for Males and for Females in the U.S. since 1960. (It doesn’t have to be exact, just the basic idea and some reasonably close numbers.) Give one reason for the trend in Male LFRP and one reason for the trend in Female LFRP
- (10 points) Explain the theory of why specific training is paid for by the firm instead of the worker.
Homework Answers
Answer.1.
There was an increase in participation among women and that was
the driving force behind the rise in the overall participation rate
during the latter half of the 20th century. Although the labor
force participation of women aged 25 to 54 years grew steadily over
this period, the pace of the increase varied. The largest increase
in women’s labor force participation occurred in the 1970s which
were 13.9 percentage points, followed by the 1980s where it was 10
percentage points. During most of the 1990s, the participation rate
for women aged 25 to 54 years continued to rise, peaking at 76.8
percent in 1999 but, in the years soon after, the rate flattened
out. By 2005, the labor force participation rate of women aged 25
to 54 years receded slightly, to 75.3 percent. From 1972 until the
late 1990s, labor force participation increased for all the race
and ethnic groups, but since 1999, the rates have declined. In
earlier generations, full-time homemaking was considered the norm
for mothers, but, apparently, the current generation views labor
force participation as playing an integral role in mothers’
lives.
The reasons for the changes in labor force participation among
women:
a)The presence and the age of children, apparently some highly
educated professional women dropped out labor force to care for
their young children.
Males:
A significant development in the labor force over the past 50 years
has been the steady decline in labor force participation among men
aged 25 to 54 years. After peaking at 97.4 percent in the
mid-1950s, the participation rate for the men has fallen steadily,
reaching a low of 90.5 percent in2005. Dropping by an average of
0.8 percentage point each decade between 1950 and 1990, the labor
force participation rate for men aged 25 to 54 years has declined
much more since the 1990s. For example, between 1990 and 2000 the
rate fell by 1.8 percentage points, and since 2000 it has dropped
by 1.1 percentage points.
Causes for changes in male labor force participation rate:
a)Educational attainment level and the types of jobs available to
the less educated are less desirable.
b)Access to social security benefits.
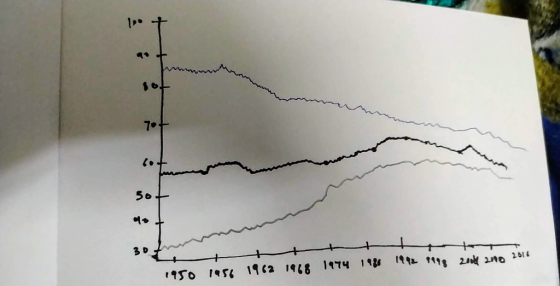
In the given figure, this is the representation of us labor force participation rate since 1950
Blue represents men, grey represents women and black represents total.the horizontal axis depicts years and the range here is 6 years.
Add Answer to:
Pick one of these and answer it. (If you pick both, no points for you!) (10...
Make a graph to show the trends in Labor Force Participation rate for Males and for...
Make a graph to show the trends in Labor Force Participation rate for Males and for Females in the U.S. since 1960. (It doesn’t have to be exact, just the basic idea and some reasonably close numbers.) Give one reason for the trend in Male LFRP and one reason for the trend in Female LFRP
Utolbl 5 2) (15 points) You have obtainer male students (Student a binary variable (Female), which...
 Utolbl 5 2) (15 points) You have obtainer male students (Student a binary variable (Female), which yields the following result: ints) You have obtained measurements of height in inches of 29 female and 81 dents (Studenth) at your university. A regression of the height on a constant and variable (Female), which takes a value of one for females and is zero otherwise, Studenth = 71.0 - 4.84xFemale, R2 = 0.40, SER = 2.0 (0.3) (0.57) (a) Calculate the average height...
Question 10 of 30 1.0 Points Please use the following scenario to answer the question: In...
 Question 10 of 30 1.0 Points Please use the following scenario to answer the question: In 2001, a total of 15,555 homicide deaths occurred among males and 4,753 homicide deaths occurred among females. The estimated 2001 midyear populations for males and females were 139,813,000 and 144,984,000, respectively. What is the homicide-related death rate for males (per 100,000 population)? OA. 5.4 per 100,000 B. 7.1 per 100,000 O C. 11.1 per 100,000 O D. 12.6 per 100,000 Reset Selection Question 11...
a) You reason that this is because experience is related to "on the job training." One...
 a) You reason that this is because experience is related to "on
the job training." One frequently used measure for (potential)
experience is "Age-Education-6." This means subtracting years of
education minus 6. Explain the underlying rationale.
b) Assuming, heroically, that education is constant across the
1,744 individuals, you consider regressing earnings on age and a
binary variable for gender. You estimate two specifications
initially:
c) Assuming, heroically, that education is constant across the
1,744 individuals, you consider regressing earnings on...
a) You reason that this is because experience is related to "on
the job training." One frequently used measure for (potential)
experience is "Age-Education-6." This means subtracting years of
education minus 6. Explain the underlying rationale.
b) Assuming, heroically, that education is constant across the
1,744 individuals, you consider regressing earnings on age and a
binary variable for gender. You estimate two specifications
initially:
c) Assuming, heroically, that education is constant across the
1,744 individuals, you consider regressing earnings on...
For the following Motivational Theories, please pick ONE THEORY to answer the following 2 questions. (10...
For the following Motivational Theories, please pick ONE THEORY to answer the following 2 questions. (10 points in total) Please select 1 theory from the list: a) Maslow’s Hierarchy of Needs b) Theory X c) Herzberg’s Two Factor Theory d) Equity Theory e) Expectancy Theory Please answer the following TWO questions: 1) Please use no more than 3 sentences to explain your chosen theory. (6 points) 2) If you were a manager, please give 1 example on how to apply...
5. Presenting means in graphs Aa Aa Suppose you randomly decide whether to administer Treatment A...
 5. Presenting means in graphs Aa Aa Suppose you randomly decide whether to administer Treatment A or Treatment B to each of 120 volunteers, such that 40 female volunteers received Treatment A, 20 female volunteers received Treatment B, 20 male volunteers received Treatment A, and 40 male volunteers received Treatment B. Treatments A and B are two different doses of the same drug intended to improve memory. After volunteers receive their treatment, they take a memory test and are given...
Draw the complete synthesis of the compounds Question 44 (10 points) Pick One! Draw the complete,...
 Draw the complete synthesis of the compounds
Question 44 (10 points) Pick One! Draw the complete, detailed synthesis of one of the three compounds below on your paper. You may use benzene, cyclohexane, or cyclohexanone as one of your starting compounds. You can use any monofunctional organic compound with one or two carbons. You can use any inorganic reagents of your choice. Up to 3 points will be awarded for each additional synthesis problem done correctly. (10 points) < Paragraph...
Draw the complete synthesis of the compounds
Question 44 (10 points) Pick One! Draw the complete, detailed synthesis of one of the three compounds below on your paper. You may use benzene, cyclohexane, or cyclohexanone as one of your starting compounds. You can use any monofunctional organic compound with one or two carbons. You can use any inorganic reagents of your choice. Up to 3 points will be awarded for each additional synthesis problem done correctly. (10 points) < Paragraph...
TIPAMT – Tip Amount (coded as 1, 2, 3, 4, or 5) where 1 = <10%; 2 = 10-12%; 3 = 12-14%; 4 = 15...
TIPAMT – Tip Amount (coded as 1, 2, 3, 4, or 5) where 1 = <10%; 2 = 10-12%; 3 = 12-14%; 4 = 15-16%; 5 = >18%. (TIPAMT was directly measured from customers’ payments for the checks). MLTSRV – Multiple Servers in Attendance (0=No; 1=Yes). (For customers on Tuesday, this variable was coded as 1. For customers on Wednesday, this variable was coded as 0). #PRTY - # of Individuals in the Party. (The primary server noted the number...
Question 3 Experience has shown that Male applicants to Virginia Tech score on average 3.5 points...
 Question 3 Experience has shown that Male applicants to Virginia Tech score on average 3.5 points better on the science placement than Female applicants. Following a random sample of these years freshman applications for admission resulted in the data below: Gender Males Females Sample Size 25 35 Mean Score 71.5 71.2 Standard deviation 10.3 11.2 A) Is there sufficient evidence that males score significantly better at the alpha-0.05 level. (10 points) For the next four questions state which inference procedure...
Homework (Due Thursday, January 31, 12:30pm.) Required (hand in) 1. In the table below you see...
 Homework (Due Thursday, January 31, 12:30pm.) Required (hand in) 1. In the table below you see unlabeled force diagams for balls in different situations: Match the diagrams with the following descriptions (1) A ball is moving upward after it leaves your hand (2) You hold a ball in your hand. (3) A ball is falling down (4) You are throwing a ball (still in your hand) straight up. (5) You are lifting a bowling ball at a constant rate. For...
 Utolbl 5 2) (15 points) You have obtainer male students (Student a binary variable (Female), which yields the following result: ints) You have obtained measurements of height in inches of 29 female and 81 dents (Studenth) at your university. A regression of the height on a constant and variable (Female), which takes a value of one for females and is zero otherwise, Studenth = 71.0 - 4.84xFemale, R2 = 0.40, SER = 2.0 (0.3) (0.57) (a) Calculate the average height...
 Question 10 of 30 1.0 Points Please use the following scenario to answer the question: In 2001, a total of 15,555 homicide deaths occurred among males and 4,753 homicide deaths occurred among females. The estimated 2001 midyear populations for males and females were 139,813,000 and 144,984,000, respectively. What is the homicide-related death rate for males (per 100,000 population)? OA. 5.4 per 100,000 B. 7.1 per 100,000 O C. 11.1 per 100,000 O D. 12.6 per 100,000 Reset Selection Question 11...
 a) You reason that this is because experience is related to "on
the job training." One frequently used measure for (potential)
experience is "Age-Education-6." This means subtracting years of
education minus 6. Explain the underlying rationale.
b) Assuming, heroically, that education is constant across the
1,744 individuals, you consider regressing earnings on age and a
binary variable for gender. You estimate two specifications
initially:
c) Assuming, heroically, that education is constant across the
1,744 individuals, you consider regressing earnings on...
a) You reason that this is because experience is related to "on
the job training." One frequently used measure for (potential)
experience is "Age-Education-6." This means subtracting years of
education minus 6. Explain the underlying rationale.
b) Assuming, heroically, that education is constant across the
1,744 individuals, you consider regressing earnings on age and a
binary variable for gender. You estimate two specifications
initially:
c) Assuming, heroically, that education is constant across the
1,744 individuals, you consider regressing earnings on...
 5. Presenting means in graphs Aa Aa Suppose you randomly decide whether to administer Treatment A or Treatment B to each of 120 volunteers, such that 40 female volunteers received Treatment A, 20 female volunteers received Treatment B, 20 male volunteers received Treatment A, and 40 male volunteers received Treatment B. Treatments A and B are two different doses of the same drug intended to improve memory. After volunteers receive their treatment, they take a memory test and are given...
 Draw the complete synthesis of the compounds
Question 44 (10 points) Pick One! Draw the complete, detailed synthesis of one of the three compounds below on your paper. You may use benzene, cyclohexane, or cyclohexanone as one of your starting compounds. You can use any monofunctional organic compound with one or two carbons. You can use any inorganic reagents of your choice. Up to 3 points will be awarded for each additional synthesis problem done correctly. (10 points) < Paragraph...
Draw the complete synthesis of the compounds
Question 44 (10 points) Pick One! Draw the complete, detailed synthesis of one of the three compounds below on your paper. You may use benzene, cyclohexane, or cyclohexanone as one of your starting compounds. You can use any monofunctional organic compound with one or two carbons. You can use any inorganic reagents of your choice. Up to 3 points will be awarded for each additional synthesis problem done correctly. (10 points) < Paragraph...
 Question 3 Experience has shown that Male applicants to Virginia Tech score on average 3.5 points better on the science placement than Female applicants. Following a random sample of these years freshman applications for admission resulted in the data below: Gender Males Females Sample Size 25 35 Mean Score 71.5 71.2 Standard deviation 10.3 11.2 A) Is there sufficient evidence that males score significantly better at the alpha-0.05 level. (10 points) For the next four questions state which inference procedure...
 Homework (Due Thursday, January 31, 12:30pm.) Required (hand in) 1. In the table below you see unlabeled force diagams for balls in different situations: Match the diagrams with the following descriptions (1) A ball is moving upward after it leaves your hand (2) You hold a ball in your hand. (3) A ball is falling down (4) You are throwing a ball (still in your hand) straight up. (5) You are lifting a bowling ball at a constant rate. For...
Most questions answered within 3 hours.
-
Write a program to solve the Josephus problem, with the following
modification:
Sample Input:
./a.out n...
asked 1 hour ago -
At the start of a CD it is spinning at a rate of 525 rpm
(revolutions...
asked 2 hours ago -
4. Without doing any calculations, predict whether the observed
∆T would increase, decrease or remain the...
asked 3 hours ago -
Based on the range, which of the following sets of scores has
the greatest variability? 3,...
asked 4 hours ago -
Ripples in a pond travel at a velocity of 3 m/s with one peak
passing a...
asked 4 hours ago -
A man stands on the roof of a building of height 13.0 mm and
throws a...
asked 4 hours ago -
The extent to which assets are financed by borrowed funds and
other liabilities is indicated by:...
asked 5 hours ago -
Explain in detail
Germany is the fifth largest economy
explain what goods and services Germany specializes...
asked 6 hours ago -
The density of platinum is 21.45 g/mL. If a cube of platinum
with a mass of...
asked 6 hours ago -
Accounts Receivable
Sales
A/R Posting
Extended Sales Invoice
Packing Slip
Compare invoice to packing slip 2...
asked 6 hours ago -
Michaella, age 23, is a full-time law student and is claimed by
her parents as a...
asked 6 hours ago -
Why are polymers not typically casted into products?
asked 6 hours ago