
Homework Answers
(a)
We will use birthdate as 20010610 as shown in below code.
birthday = 20010610
set.seed(birthday)
(b)
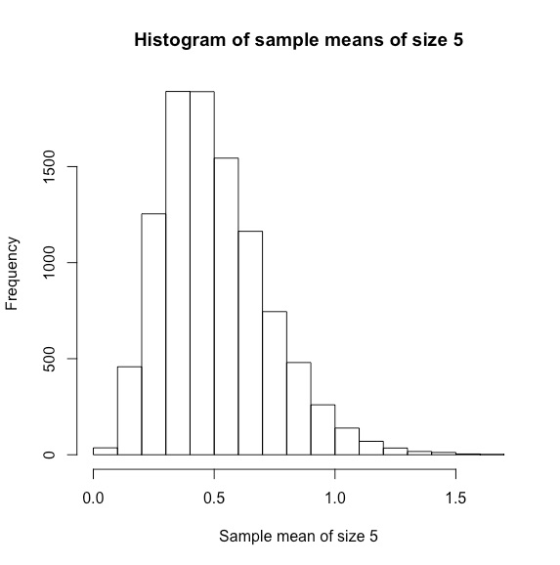
Below code simulate 10,000 samples of size 5 from an exponential
distribution with = 2. The shape
of the histogram is not symmetrical, as it is skewed to the right.
Based on histogram, the central limit theorem does not applies.
birthday = 20010610
set.seed(birthday)
x = numeric()
for (i in 1:10000) {
samples = rexp(5, rate = 2)
x = c(x, mean(samples))
}
hist(x, xlab = "Sample mean of size 5", main = "Histogram of sample
means of size 5")
(c)
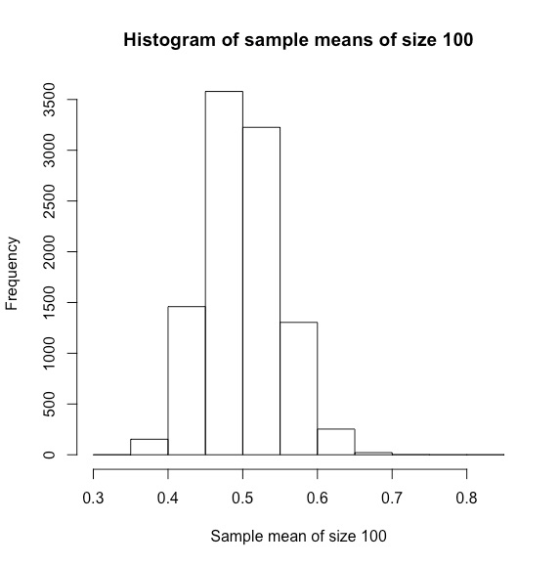
Below code simulate 10,000 samples of size 100 from an
exponential distribution with = 2. The
histogram shape is symmetrical. Thus, based on histogram, the
central limit theorem applies.
birthday = 20010610
set.seed(birthday)
x = numeric()
for (i in 1:10000) {
samples = rexp(100, rate = 2)
x = c(x, mean(samples))
}
hist(x, xlab = "Sample mean of size 100", main = "Histogram of
sample means of size 100")
(d)
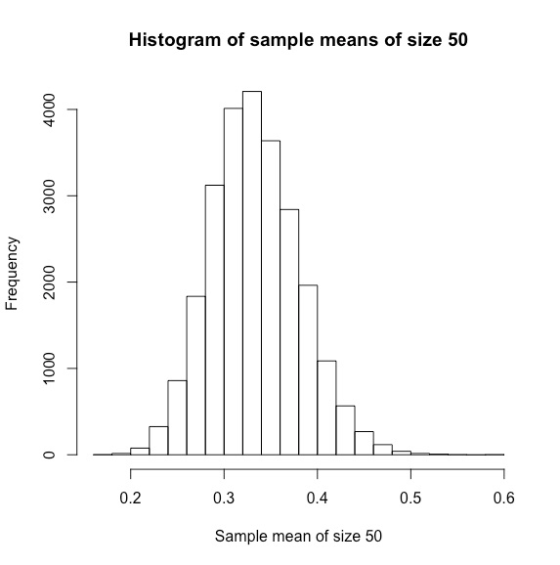
Below is the function sim_xbars_exp which will take the simulation size, sample size and rate parameter to generate sample means of the exponential distribution.
sim_xbars_exp = function(simulation_size, sample_size,
lambda) {
birthday = 20010610
set.seed(birthday)
x = numeric()
for (i in 1:simulation_size) {
samples = rexp(sample_size, rate = lambda)
x = c(x, mean(samples))
}
return(x)
}
Calling the function and storing the mean vector in y and then plotting the histogram.
y = sim_xbars_exp(25000, 50, 3)
hist(y, xlab = "Sample mean of size 50", main = "Histogram of
sample means of size 50")
Add Answer to:
Using R, Exercise 4 (CLT Simulation) For this exercise we will simulate from the exponential distribution....
Please complete using R. Show all code needed to complete exercise. Will Thumbs up if done...
 Please complete using R. Show all code needed to
complete exercise. Will Thumbs up if done neatly and
correctly.
Exercise 5 (More Simulation) Let X follow an exponential distribution with rate parameter λx = 2. Let Y follow a Poisson distribution with rate parameter λ 3. We write sd(X) for the true standard deviation of X and m(Y) for the true median of Y Let s be the sample standard median which is an estimate of m(Y) Suppose we take...
Please complete using R. Show all code needed to
complete exercise. Will Thumbs up if done neatly and
correctly.
Exercise 5 (More Simulation) Let X follow an exponential distribution with rate parameter λx = 2. Let Y follow a Poisson distribution with rate parameter λ 3. We write sd(X) for the true standard deviation of X and m(Y) for the true median of Y Let s be the sample standard median which is an estimate of m(Y) Suppose we take...
Please use html format! II. The goal of this problem is to simulate the distribution of the sample mean. We will...
 Please use html format!
II. The goal of this problem is to simulate the distribution of the sample mean. We will use the buit load the dataset and avoid some problems, copy and paste the following command in dataset 1ynx. To lynx as.numeric(lynx) Assume this vector represents the population. Le, the mean of this vector is our "true mean" (a) Draw a histogram of the population, find the "true" mean, and the true" variance. Does this data look normally distributed?...
Please use html format!
II. The goal of this problem is to simulate the distribution of the sample mean. We will use the buit load the dataset and avoid some problems, copy and paste the following command in dataset 1ynx. To lynx as.numeric(lynx) Assume this vector represents the population. Le, the mean of this vector is our "true mean" (a) Draw a histogram of the population, find the "true" mean, and the true" variance. Does this data look normally distributed?...
In the notes there is a Central Limit Theorem example in which a sampling distribution of means i...
 R Programming codes for the above questions?
In the notes there is a Central Limit Theorem example in which a sampling distribution of means is created using a for loop, and then this distribution is plotted. This distribution should look approximately like a normal distribution. However, not all statistics have normal sampling distributions. For this problem, you'll create a sampling distribution of standard deviations rather than means. 3. Using a for loop, draw 10,000 samples of size n-30 from a...
R Programming codes for the above questions?
In the notes there is a Central Limit Theorem example in which a sampling distribution of means is created using a for loop, and then this distribution is plotted. This distribution should look approximately like a normal distribution. However, not all statistics have normal sampling distributions. For this problem, you'll create a sampling distribution of standard deviations rather than means. 3. Using a for loop, draw 10,000 samples of size n-30 from a...
Python 3.7 please help please use central limit theory In this problem you will verify the...
 Python 3.7 please help
please use central limit theory
In this problem you will verify the Central Limit Theorem (CLT) which states that averages, from repeated random samples of any distribution, follow a normal distribution 1. (5 points) Draw a random sample of 5,000 random numbers from a uniform distribution X ~U (20,80] and store them into a vector called xy and plot a histogram of these 5,000 numbers 2. (5 points) Draw a random sample of 5,000 random numbers...
Python 3.7 please help
please use central limit theory
In this problem you will verify the Central Limit Theorem (CLT) which states that averages, from repeated random samples of any distribution, follow a normal distribution 1. (5 points) Draw a random sample of 5,000 random numbers from a uniform distribution X ~U (20,80] and store them into a vector called xy and plot a histogram of these 5,000 numbers 2. (5 points) Draw a random sample of 5,000 random numbers...
Independent random samples X1, X2, . . . , Xn are from exponential distribution with pdfs...
 Independent random samples X1, X2, . . . , Xn are from
exponential distribution with pdfs
, xi > 0, where λ is fixed but unknown. Let
. Here we have a relative large sample size n = 100.
(ii) Notice that the population mean here is µ = E(X1) = 1/λ ,
population variance σ^2 = Var(X1) = 1/λ^2 is unknown. Assume the
sample standard deviation s = 10, sample average
= 5, construct a 95% large-sample approximate confidence...
Independent random samples X1, X2, . . . , Xn are from
exponential distribution with pdfs
, xi > 0, where λ is fixed but unknown. Let
. Here we have a relative large sample size n = 100.
(ii) Notice that the population mean here is µ = E(X1) = 1/λ ,
population variance σ^2 = Var(X1) = 1/λ^2 is unknown. Assume the
sample standard deviation s = 10, sample average
= 5, construct a 95% large-sample approximate confidence...
R codeing simulation For n = 20, simulate a random sample of size n from N(µ, 2 2 ), where µ = 1....
 R codeing simulation
For n = 20, simulate a random
sample of size n from N(µ, 2 2 ), where µ = 1. Note that we just
use µ = 1 to generate the random sample. In the problem below, µ is
an unknown parameter. Plot in different figures: (a) the likelihood
function of µ, (b) the log likelihood function of µ. Mark in both
plots the maximum likelihood estimate of µ from the generated
random sample
(2) For n-20,...
R codeing simulation
For n = 20, simulate a random
sample of size n from N(µ, 2 2 ), where µ = 1. Note that we just
use µ = 1 to generate the random sample. In the problem below, µ is
an unknown parameter. Plot in different figures: (a) the likelihood
function of µ, (b) the log likelihood function of µ. Mark in both
plots the maximum likelihood estimate of µ from the generated
random sample
(2) For n-20,...
[25 points] Problem 4 - CDF Inversion Sampling ers coming from the U(0, 1) distribution into...
 [25 points] Problem 4 - CDF Inversion Sampling ers coming from the U(0, 1) distribution into In notebook 12, we looked at one method many pieces of statistical software use to turn pseudorandom those with a normal distribution. In this problem we examine another such method. a) Simulating an Exponential i) The exponential distribution has pdf f(x) = le-ix for x > 0. Use the following markdown cell to compute by hand the cdf of the exponential. ii) The cdf...
1. Jason is thinking about getting a trampoline for his son's birthday party. He knows that...
 1. Jason is thinking about getting a trampoline for his son's birthday party. He knows that the weights of children are normally distributed, with a mean of 70 pounds and a standard deviation of 8 pounds. a) Jason decides to set the limit to 4 children on the trampoline. What does Central Limit Theorem (CLT) tell us about the mean and standard error of the sampling distribution of means for random samples of size 4 children? b) Sketch the sampling...
We will be using Excel to simulate a normal distribution with a mean of 500 and...
We will be using Excel to simulate a normal distribution with a mean of 500 and a standard deviation of 9. Please note there are five parts to this question. First, generate a random sample of 50 data points. 1. Create a histogram where the first bin starts at 475.25 and the width of each bin is 4.5. You can have your last bin be 520.25. Save that histogram as an image file and attach it here using the Insert...
1. Suppose that Xi,..,Xn are independent Exponential random variables with density f(x; λ) λ exp(-1x) for...
 1. Suppose that Xi,..,Xn are independent Exponential random variables with density f(x; λ) λ exp(-1x) for x > 0 where λ > 0 is an unknown parameter (a) Show that the τ quantile of the Exponential distribution is F-1 (r)--X1 In(1-7) and give an approximation to Var(X(k)) for k/n-T. What happens to this variance as τ moves from 0 to 1? (b) The form of the quantile function in part (a) can be used to give a quantile-quantile (QQ) plot...
 Please complete using R. Show all code needed to
complete exercise. Will Thumbs up if done neatly and
correctly.
Exercise 5 (More Simulation) Let X follow an exponential distribution with rate parameter λx = 2. Let Y follow a Poisson distribution with rate parameter λ 3. We write sd(X) for the true standard deviation of X and m(Y) for the true median of Y Let s be the sample standard median which is an estimate of m(Y) Suppose we take...
Please complete using R. Show all code needed to
complete exercise. Will Thumbs up if done neatly and
correctly.
Exercise 5 (More Simulation) Let X follow an exponential distribution with rate parameter λx = 2. Let Y follow a Poisson distribution with rate parameter λ 3. We write sd(X) for the true standard deviation of X and m(Y) for the true median of Y Let s be the sample standard median which is an estimate of m(Y) Suppose we take...
 Please use html format!
II. The goal of this problem is to simulate the distribution of the sample mean. We will use the buit load the dataset and avoid some problems, copy and paste the following command in dataset 1ynx. To lynx as.numeric(lynx) Assume this vector represents the population. Le, the mean of this vector is our "true mean" (a) Draw a histogram of the population, find the "true" mean, and the true" variance. Does this data look normally distributed?...
Please use html format!
II. The goal of this problem is to simulate the distribution of the sample mean. We will use the buit load the dataset and avoid some problems, copy and paste the following command in dataset 1ynx. To lynx as.numeric(lynx) Assume this vector represents the population. Le, the mean of this vector is our "true mean" (a) Draw a histogram of the population, find the "true" mean, and the true" variance. Does this data look normally distributed?...
 R Programming codes for the above questions?
In the notes there is a Central Limit Theorem example in which a sampling distribution of means is created using a for loop, and then this distribution is plotted. This distribution should look approximately like a normal distribution. However, not all statistics have normal sampling distributions. For this problem, you'll create a sampling distribution of standard deviations rather than means. 3. Using a for loop, draw 10,000 samples of size n-30 from a...
R Programming codes for the above questions?
In the notes there is a Central Limit Theorem example in which a sampling distribution of means is created using a for loop, and then this distribution is plotted. This distribution should look approximately like a normal distribution. However, not all statistics have normal sampling distributions. For this problem, you'll create a sampling distribution of standard deviations rather than means. 3. Using a for loop, draw 10,000 samples of size n-30 from a...
 Python 3.7 please help
please use central limit theory
In this problem you will verify the Central Limit Theorem (CLT) which states that averages, from repeated random samples of any distribution, follow a normal distribution 1. (5 points) Draw a random sample of 5,000 random numbers from a uniform distribution X ~U (20,80] and store them into a vector called xy and plot a histogram of these 5,000 numbers 2. (5 points) Draw a random sample of 5,000 random numbers...
Python 3.7 please help
please use central limit theory
In this problem you will verify the Central Limit Theorem (CLT) which states that averages, from repeated random samples of any distribution, follow a normal distribution 1. (5 points) Draw a random sample of 5,000 random numbers from a uniform distribution X ~U (20,80] and store them into a vector called xy and plot a histogram of these 5,000 numbers 2. (5 points) Draw a random sample of 5,000 random numbers...
 Independent random samples X1, X2, . . . , Xn are from
exponential distribution with pdfs
, xi > 0, where λ is fixed but unknown. Let
. Here we have a relative large sample size n = 100.
(ii) Notice that the population mean here is µ = E(X1) = 1/λ ,
population variance σ^2 = Var(X1) = 1/λ^2 is unknown. Assume the
sample standard deviation s = 10, sample average
= 5, construct a 95% large-sample approximate confidence...
Independent random samples X1, X2, . . . , Xn are from
exponential distribution with pdfs
, xi > 0, where λ is fixed but unknown. Let
. Here we have a relative large sample size n = 100.
(ii) Notice that the population mean here is µ = E(X1) = 1/λ ,
population variance σ^2 = Var(X1) = 1/λ^2 is unknown. Assume the
sample standard deviation s = 10, sample average
= 5, construct a 95% large-sample approximate confidence...
 R codeing simulation
For n = 20, simulate a random
sample of size n from N(µ, 2 2 ), where µ = 1. Note that we just
use µ = 1 to generate the random sample. In the problem below, µ is
an unknown parameter. Plot in different figures: (a) the likelihood
function of µ, (b) the log likelihood function of µ. Mark in both
plots the maximum likelihood estimate of µ from the generated
random sample
(2) For n-20,...
R codeing simulation
For n = 20, simulate a random
sample of size n from N(µ, 2 2 ), where µ = 1. Note that we just
use µ = 1 to generate the random sample. In the problem below, µ is
an unknown parameter. Plot in different figures: (a) the likelihood
function of µ, (b) the log likelihood function of µ. Mark in both
plots the maximum likelihood estimate of µ from the generated
random sample
(2) For n-20,...
 [25 points] Problem 4 - CDF Inversion Sampling ers coming from the U(0, 1) distribution into In notebook 12, we looked at one method many pieces of statistical software use to turn pseudorandom those with a normal distribution. In this problem we examine another such method. a) Simulating an Exponential i) The exponential distribution has pdf f(x) = le-ix for x > 0. Use the following markdown cell to compute by hand the cdf of the exponential. ii) The cdf...
 1. Jason is thinking about getting a trampoline for his son's birthday party. He knows that the weights of children are normally distributed, with a mean of 70 pounds and a standard deviation of 8 pounds. a) Jason decides to set the limit to 4 children on the trampoline. What does Central Limit Theorem (CLT) tell us about the mean and standard error of the sampling distribution of means for random samples of size 4 children? b) Sketch the sampling...
 1. Suppose that Xi,..,Xn are independent Exponential random variables with density f(x; λ) λ exp(-1x) for x > 0 where λ > 0 is an unknown parameter (a) Show that the τ quantile of the Exponential distribution is F-1 (r)--X1 In(1-7) and give an approximation to Var(X(k)) for k/n-T. What happens to this variance as τ moves from 0 to 1? (b) The form of the quantile function in part (a) can be used to give a quantile-quantile (QQ) plot...
Most questions answered within 3 hours.
-
Lourdes LLC. keeps a $100 change fund in its cash register. At
the end of the...
asked 1 minute ago -
If the barometric pressure is 107.4 kPa, what is the pressure in
kPa of the gas...
asked 3 minutes ago -
State the operation or control mechanism of TRIAC, DIAC, UJT, PUT,
GTO and IGBT.
asked 4 minutes ago -
Generator An AC generator supplies an rms voltage of 220 V at
50.0 Hz. It is...
asked 6 minutes ago -
Cars enter a car wash at a mean rate of 2 cars per half an hour....
asked 18 minutes ago -
Write SQL queries to answer the following question: A. Which
students are enrolled in Database and...
asked 32 minutes ago -
Required:
How was Dell computer working capital policy as a competitive
advantage? Write at least 200...
asked 14 minutes ago -
Your eye is 2.5 m away from a 60W light bulb that emits light in
all...
asked 21 minutes ago -
As a human and using your own human Intelligent Analysis (IA),
you would have noted that...
asked 23 minutes ago -
Transverse waves on a string have wave speed 8 m/s, amplitude
0.071 m, and wavelength 0.33...
asked 37 minutes ago -
At −11°C a sample of carbon monoxide gas exerts a pressure of
0.45 atm. What is...
asked 37 minutes ago -
Aqueous hydrobromic acid HBr reacts with solid sodium hydroxide
NaOH to produce aqueous sodium bromide NaBr...
asked 51 minutes ago