R codeing simulation
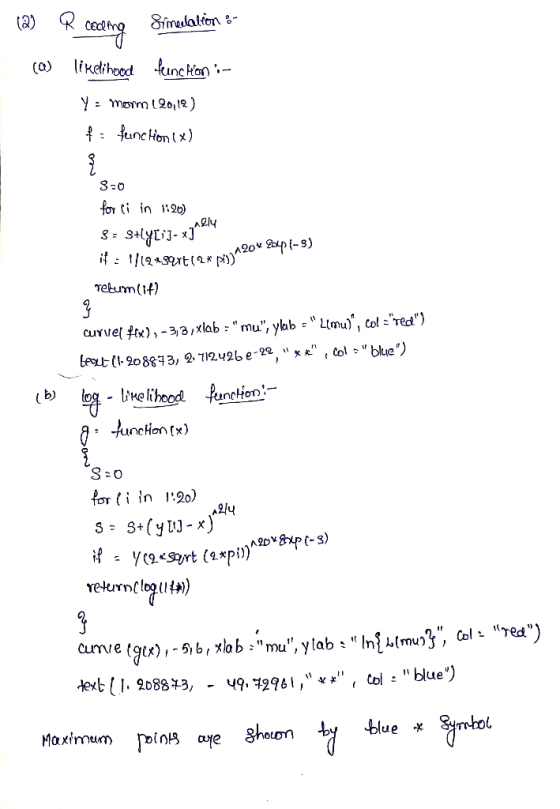
 For n = 20, simulate a random
sample of size n from N(µ, 2 2 ), where µ = 1. Note that we just
use µ = 1 to generate the random sample. In the problem below, µ is
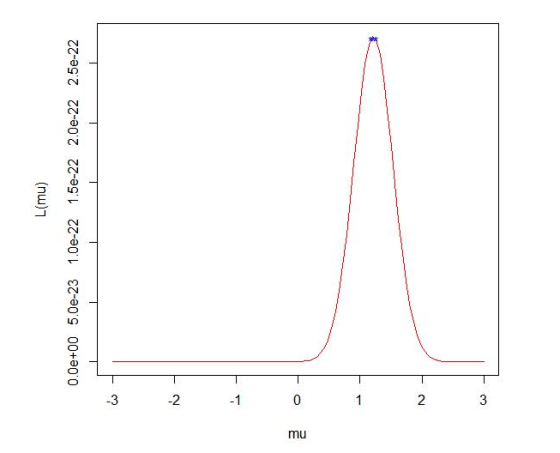
an unknown parameter. Plot in different figures: (a) the likelihood
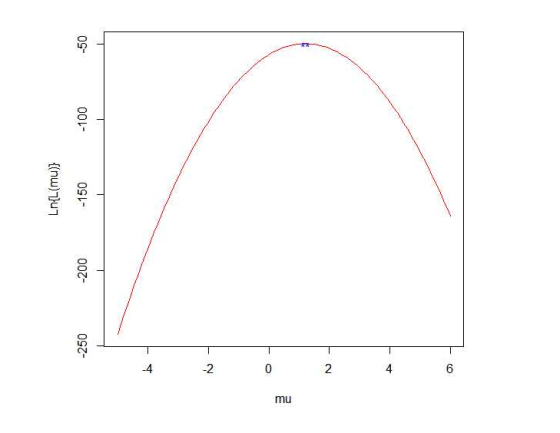
function of µ, (b) the log likelihood function of µ. Mark in both
plots the maximum likelihood estimate of µ from the generated
random sample
For n = 20, simulate a random
sample of size n from N(µ, 2 2 ), where µ = 1. Note that we just
use µ = 1 to generate the random sample. In the problem below, µ is
an unknown parameter. Plot in different figures: (a) the likelihood
function of µ, (b) the log likelihood function of µ. Mark in both
plots the maximum likelihood estimate of µ from the generated
random sample
Homework Answers
Add Answer to:
R codeing simulation For n = 20, simulate a random sample of size n from N(µ, 2 2 ), where µ = 1....
For n = 20, simulate a random sample of size n from N(μ,22), where μ =...
For n = 20, simulate a random sample of size n from N(μ,22), where μ = 1. Note that we just use μ = 1 to generate the random sample. In the problem below, μ is an unknown parameter. Plot in different figures: (a) the likelihood function of μ, (b) the log likelihood function of μ. Mark in both plots the maximum likelihood estimate of μ from the generated random sample.
Problem 2. Consider a random sample of size n from a two-parameter distribution with parameter 0...
 Problem 2. Consider a random sample of size n from a two-parameter distribution with parameter 0 unknown and parameter η known. The population density function is (xi - T) (a) Find the likelihood function simplifying it as much as possible. Likelihood
Using R, Exercise 4 (CLT Simulation) For this exercise we will simulate from the exponential distribution....
 Using R,
Exercise 4 (CLT Simulation) For this exercise we will simulate from the exponential distribution. If a random variable X has an exponential distribution with rate parameter A, the pdf of X can be written for z 2 0 Also recall, (a) This exercise relies heavily on generating random observations. To make this reproducible we will set a seed for the randomization. Alter the following code to make birthday store your birthday in the format yyyymmdd. For example, William...
Using R,
Exercise 4 (CLT Simulation) For this exercise we will simulate from the exponential distribution. If a random variable X has an exponential distribution with rate parameter A, the pdf of X can be written for z 2 0 Also recall, (a) This exercise relies heavily on generating random observations. To make this reproducible we will set a seed for the randomization. Alter the following code to make birthday store your birthday in the format yyyymmdd. For example, William...
Simulate n values of an exponential random variable X with parameter λ (of your choice), and comp...
 Simulate n values of an exponential random variable X with parameter λ (of your choice), and compute the sample mean i, sample median m, sample standard deviation s. Plot these quantities as functions of n (on three separate plots). Do x, m, and s converge to any limit values, as n-oo? What are those values and how are they related? Estimate the variance of both x and m for a particular value of n, such as n 100 (by generating,...
How to do the following in R: Write a function to generate a random sample of size n from the Gam...
How to do the following in R: Write a function to generate a random sample of size n from the Gamma(α,1) distribution by the acceptance-rejection method. Generate a random sample of size 1000 from the Gamma(3,1) distribution. (Hint: you may use g(x) ∼ Exp(λ = 1/α) as your proposal distribution, where λ is the rate parameter. Figure out the appropriate constant c).
1. Suppose you are drawing a random sample of size n > 0 from N(μ, σ2)...
 1. Suppose you are drawing a random sample of size n > 0 from N(μ, σ2) where σ > 0 is known. Decide if the following statements are true or false and explain your reasoning. Assume our 95% confidence procedure is (X- 1.96X+1.96 Vn a. If (3.2, 5.1) is a 95% CI from a particular random sample, then there is a 95% chance that μ is in this interval. b. If (3.2.5.1) is a 95% CI from a particular random...
Let X1, X2,... X,n be a random sample of size n from a distribution with probability...
 Let X1, X2,... X,n be a random sample of size n from a distribution with probability density function obtain the maximum likelihood estimator of λ, λ. Calculate an estimate using this maximum likelihood estimator when 1 0.10, r2 0.20, 0.30, x 0.70.
20. Problem 2: (12 points) Let X1, ..., Xn represent a random sample of size n...
 20. Problem 2: (12 points) Let X1, ..., Xn represent a random sample of size n from a Rayleigh distribution with parameter 0 and p.d.f. f(0,0) = - , (a) Sow that this is a valid p.d.f. [2] (b) Derive the c.d.f of X. [2] (c) Use the c.d.f of X to obtain the median value of X and interpret it. [2] (d) Find the maximum likelihood estimate of 0. [3] (e) You are now given a random sample of...
STATS Use the R function rnorm() to simulate selecting a random sample of size 25 from...
STATS Use the R function rnorm() to simulate selecting a random sample of size 25 from a population with mean 80 and s.d. 20. The goal here is to show how contamination affects the mean, s.d., and z-scores. (a) Obtain the sample mean and sample sd of the simulated sample and use them to obtain the z-score for 100. (b) Create the vector contam = c(0,seq(1000,10000,length=21)) To show the effects of contamination, separately add each value of contam to the...
just explain in words 1. Suppose you are drawing a random sample of size n >...
 just explain in words
1. Suppose you are drawing a random sample of size n > 0 from n(μ, σ2) where σ 0 is known. Decide if the following statements are true or false and explain your reasoning. Assume our 95% confidence procedure is X - 1.96, X +1.96 小2 Vn a. If (3.2.5.1) is a 95% CI from a particular random sample, then there is a 95% chance that μ is in this interval. b. If (32.5.1) is a...
just explain in words
1. Suppose you are drawing a random sample of size n > 0 from n(μ, σ2) where σ 0 is known. Decide if the following statements are true or false and explain your reasoning. Assume our 95% confidence procedure is X - 1.96, X +1.96 小2 Vn a. If (3.2.5.1) is a 95% CI from a particular random sample, then there is a 95% chance that μ is in this interval. b. If (32.5.1) is a...
 Problem 2. Consider a random sample of size n from a two-parameter distribution with parameter 0 unknown and parameter η known. The population density function is (xi - T) (a) Find the likelihood function simplifying it as much as possible. Likelihood
 Using R,
Exercise 4 (CLT Simulation) For this exercise we will simulate from the exponential distribution. If a random variable X has an exponential distribution with rate parameter A, the pdf of X can be written for z 2 0 Also recall, (a) This exercise relies heavily on generating random observations. To make this reproducible we will set a seed for the randomization. Alter the following code to make birthday store your birthday in the format yyyymmdd. For example, William...
Using R,
Exercise 4 (CLT Simulation) For this exercise we will simulate from the exponential distribution. If a random variable X has an exponential distribution with rate parameter A, the pdf of X can be written for z 2 0 Also recall, (a) This exercise relies heavily on generating random observations. To make this reproducible we will set a seed for the randomization. Alter the following code to make birthday store your birthday in the format yyyymmdd. For example, William...
 Simulate n values of an exponential random variable X with parameter λ (of your choice), and compute the sample mean i, sample median m, sample standard deviation s. Plot these quantities as functions of n (on three separate plots). Do x, m, and s converge to any limit values, as n-oo? What are those values and how are they related? Estimate the variance of both x and m for a particular value of n, such as n 100 (by generating,...
 1. Suppose you are drawing a random sample of size n > 0 from N(μ, σ2) where σ > 0 is known. Decide if the following statements are true or false and explain your reasoning. Assume our 95% confidence procedure is (X- 1.96X+1.96 Vn a. If (3.2, 5.1) is a 95% CI from a particular random sample, then there is a 95% chance that μ is in this interval. b. If (3.2.5.1) is a 95% CI from a particular random...
 Let X1, X2,... X,n be a random sample of size n from a distribution with probability density function obtain the maximum likelihood estimator of λ, λ. Calculate an estimate using this maximum likelihood estimator when 1 0.10, r2 0.20, 0.30, x 0.70.
 20. Problem 2: (12 points) Let X1, ..., Xn represent a random sample of size n from a Rayleigh distribution with parameter 0 and p.d.f. f(0,0) = - , (a) Sow that this is a valid p.d.f. [2] (b) Derive the c.d.f of X. [2] (c) Use the c.d.f of X to obtain the median value of X and interpret it. [2] (d) Find the maximum likelihood estimate of 0. [3] (e) You are now given a random sample of...
 just explain in words
1. Suppose you are drawing a random sample of size n > 0 from n(μ, σ2) where σ 0 is known. Decide if the following statements are true or false and explain your reasoning. Assume our 95% confidence procedure is X - 1.96, X +1.96 小2 Vn a. If (3.2.5.1) is a 95% CI from a particular random sample, then there is a 95% chance that μ is in this interval. b. If (32.5.1) is a...
just explain in words
1. Suppose you are drawing a random sample of size n > 0 from n(μ, σ2) where σ 0 is known. Decide if the following statements are true or false and explain your reasoning. Assume our 95% confidence procedure is X - 1.96, X +1.96 小2 Vn a. If (3.2.5.1) is a 95% CI from a particular random sample, then there is a 95% chance that μ is in this interval. b. If (32.5.1) is a...
Most questions answered within 3 hours.
-
is an approach for addressing bottlenecks in a process or
system.
A. Utilization
B. Breakeven Analysis...
asked 1 minute ago -
Currently, GH Co. sells 42,600 handbags annually at an average
price of $149 each. It is...
asked 22 minutes ago -
A boy of mass 60 kg and a girl of mass 40 kg are together and...
asked 24 minutes ago -
Which of the following best describes transferred-in costs?
A) they are the cost of transferring products...
asked 34 minutes ago -
Programming in C:
Write a program that accepts an integer and two floating-point
values (All three...
asked 37 minutes ago -
In hypothesis testing, it is easier to reject H0 with
a ______________
directional test (one tail)...
asked 53 minutes ago -
Requirements:
For this exercise you are to implement a small bioinformatics
library for operations with DNA...
asked 44 minutes ago -
The stockholders’ equity section of Concord Corporation’s
balance sheet at December 31 is presented here.
CONCORD...
asked 47 minutes ago -
many biochemical dissolve in the aqueous media of the cell. What
does this imply about the...
asked 55 minutes ago -
Explain how to uphold conditions relating to the work environment,
equipment, materials, procedures and special requirements
asked 53 minutes ago -
The probability of a manufacturing defect in an aluminum
beverage can is .00008 if 100,600 cans...
asked 57 minutes ago -
Which aqueous solution below is most acidic?
a. pH= 3.00
c. [-OH]= 2 x 10^-3
b....
asked 1 hour ago