
Homework Answers
3.7) Acceptance-Rejection Algorithm for continuous random variables .
1. Generate a RV 

2. Generate 

3. If 

Take 

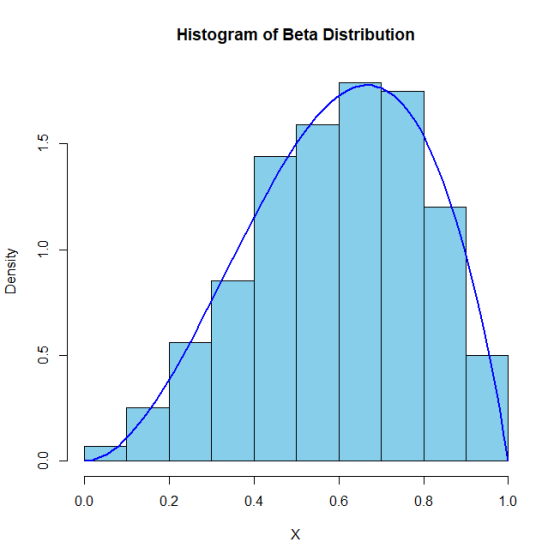
The Beta density is
To find the maximum value of , 


Thus,

The Histogram and theoretical density are plotted below.
The complete R code below.
N <- 1000
c <- 16/9
n <- 1
X <- array(dim = N)
f<- function (x)
{
12*x^2*(1-x)
}
while(n<=N)
{
Y <- runif(1)
U <- runif(1)
if(U < f(Y)/c)
{
X[n] <- Y
n <- n+1
}
}
plot(1:1)
dev.new()
hist(X,prob = TRUE, col = "skyblue", main = "Histogram of Beta
Distribution")
curve(dbeta(x,3,2),add=TRUE,lwd=2,col="blue")
Add Answer to:
#3.7 distribution. 0 and check that the mode of the generated samples is close to the...
Develop a generator for a random variable whose pdf is F(x) ={ 1/3, 0<=x<=2 1/24, 2<x<=10...
Develop a generator for a random variable whose pdf is F(x) ={ 1/3, 0<=x<=2 1/24, 2<x<=10 0, otherwise a) Write a computer routine to generate 1000 values. b) Plot a histogram of 1000 generated values. c) Perform goodness-of-fit test to determine whether these generated values fits the theoretical density function given above. Note: Invlude your computer routine for generating random variates in your answer sheet. I need numerical solution
How to do the following in R: Write a function to generate a random sample of size n from the Gam...
How to do the following in R: Write a function to generate a random sample of size n from the Gamma(α,1) distribution by the acceptance-rejection method. Generate a random sample of size 1000 from the Gamma(3,1) distribution. (Hint: you may use g(x) ∼ Exp(λ = 1/α) as your proposal distribution, where λ is the rate parameter. Figure out the appropriate constant c).
A discrete random variable X has probability mass function P() 0.1 0.2 0.2 0.2 0.3 Use...
 A discrete random variable X has probability mass function P() 0.1 0.2 0.2 0.2 0.3 Use the inverse transform method to generate a random sample of size from the distribution of X. Construct a relative frequency table and compare the empirical with the theoretical probabilities. Repeat using the R sample function. 1000
USING MATLAB PLEASE PROVIDE THE CODE. THANK YOU 1s an exponential random variable with rate parameter 2. 1. Assume (1) Generate 1000 samples from this exponential distribution using inverse transform...
 USING MATLAB PLEASE PROVIDE THE CODE. THANK YOU
1s an exponential random variable with rate parameter 2. 1. Assume (1) Generate 1000 samples from this exponential distribution using inverse transform method (2) Compare the histogram of your samples with the true density of Y
1s an exponential random variable with rate parameter 2. 1. Assume (1) Generate 1000 samples from this exponential distribution using inverse transform method (2) Compare the histogram of your samples with the true density of Y
USING MATLAB PLEASE PROVIDE THE CODE. THANK YOU
1s an exponential random variable with rate parameter 2. 1. Assume (1) Generate 1000 samples from this exponential distribution using inverse transform method (2) Compare the histogram of your samples with the true density of Y
1s an exponential random variable with rate parameter 2. 1. Assume (1) Generate 1000 samples from this exponential distribution using inverse transform method (2) Compare the histogram of your samples with the true density of Y
The distribution of GMAT scores in math for an incoming class of business studies has a...
The distribution of GMAT scores in math for an incoming class of business studies has a mean of 620 and standard deviation of 15. Assume that the score are normally distributed. Generate 25 random variates from this distribution as whole numbers. (35 points) The weekly demand of a slow-moving product has the following probability mass function Demand, x Probability, f(x) 0 0.2 1 0.4 2 0.3 3 0.1 4 or more 0 Use VLOOKUP to generate 25 random variates from...
can you guys help me to solve this problem in mathlab Y is an exponential random variable with rate param 1. Assume eter 2. (1) Generate 1000 samples from this exponential distribution using inverse...
 can you guys help me to solve this problem in mathlab
Y is an exponential random variable with rate param 1. Assume eter 2. (1) Generate 1000 samples from this exponential distribution using inverse transform method (2) Compare the histogram of your samples with the true density of Y.
Y is an exponential random variable with rate param 1. Assume eter 2. (1) Generate 1000 samples from this exponential distribution using inverse transform method (2) Compare the histogram of your...
can you guys help me to solve this problem in mathlab
Y is an exponential random variable with rate param 1. Assume eter 2. (1) Generate 1000 samples from this exponential distribution using inverse transform method (2) Compare the histogram of your samples with the true density of Y.
Y is an exponential random variable with rate param 1. Assume eter 2. (1) Generate 1000 samples from this exponential distribution using inverse transform method (2) Compare the histogram of your...
[25 points] Problem 4 - CDF Inversion Sampling ers coming from the U(0, 1) distribution into...
 [25 points] Problem 4 - CDF Inversion Sampling ers coming from the U(0, 1) distribution into In notebook 12, we looked at one method many pieces of statistical software use to turn pseudorandom those with a normal distribution. In this problem we examine another such method. a) Simulating an Exponential i) The exponential distribution has pdf f(x) = le-ix for x > 0. Use the following markdown cell to compute by hand the cdf of the exponential. ii) The cdf...
Python 3.7 please help please use central limit theory In this problem you will verify the...
 Python 3.7 please help
please use central limit theory
In this problem you will verify the Central Limit Theorem (CLT) which states that averages, from repeated random samples of any distribution, follow a normal distribution 1. (5 points) Draw a random sample of 5,000 random numbers from a uniform distribution X ~U (20,80] and store them into a vector called xy and plot a histogram of these 5,000 numbers 2. (5 points) Draw a random sample of 5,000 random numbers...
Python 3.7 please help
please use central limit theory
In this problem you will verify the Central Limit Theorem (CLT) which states that averages, from repeated random samples of any distribution, follow a normal distribution 1. (5 points) Draw a random sample of 5,000 random numbers from a uniform distribution X ~U (20,80] and store them into a vector called xy and plot a histogram of these 5,000 numbers 2. (5 points) Draw a random sample of 5,000 random numbers...
Using MATLAB 1. Assume Y is an exponential random variable with rate parameter λ=2. (1) Generate 1000 samples from this exponential distribution using inverse transform method (2) Compare the histogra...
Using MATLAB 1. Assume Y is an exponential random variable with rate parameter λ=2. (1) Generate 1000 samples from this exponential distribution using inverse transform method (2) Compare the histogram of your samples with the true density of Y.
Perform the following using Matlab For an additive Gaussian noise: a. Generate 4000 samples with ...
 using matlab
Perform the following using Matlab For an additive Gaussian noise: a. Generate 4000 samples with mean value of 3 and variance of 9. b. Plot the sample values using two different ways. c. Determine the actual mean, variance, and standard deviation. d. Determine the median, mode, and range. e. Sketch the histogram. tle- enerate and plot the probability density function (pdf) and its corresponding cumulative distribution function (cdf) ror he M For the following two signals: / and...
using matlab
Perform the following using Matlab For an additive Gaussian noise: a. Generate 4000 samples with mean value of 3 and variance of 9. b. Plot the sample values using two different ways. c. Determine the actual mean, variance, and standard deviation. d. Determine the median, mode, and range. e. Sketch the histogram. tle- enerate and plot the probability density function (pdf) and its corresponding cumulative distribution function (cdf) ror he M For the following two signals: / and...
 A discrete random variable X has probability mass function P() 0.1 0.2 0.2 0.2 0.3 Use the inverse transform method to generate a random sample of size from the distribution of X. Construct a relative frequency table and compare the empirical with the theoretical probabilities. Repeat using the R sample function. 1000
 USING MATLAB PLEASE PROVIDE THE CODE. THANK YOU
1s an exponential random variable with rate parameter 2. 1. Assume (1) Generate 1000 samples from this exponential distribution using inverse transform method (2) Compare the histogram of your samples with the true density of Y
1s an exponential random variable with rate parameter 2. 1. Assume (1) Generate 1000 samples from this exponential distribution using inverse transform method (2) Compare the histogram of your samples with the true density of Y
USING MATLAB PLEASE PROVIDE THE CODE. THANK YOU
1s an exponential random variable with rate parameter 2. 1. Assume (1) Generate 1000 samples from this exponential distribution using inverse transform method (2) Compare the histogram of your samples with the true density of Y
1s an exponential random variable with rate parameter 2. 1. Assume (1) Generate 1000 samples from this exponential distribution using inverse transform method (2) Compare the histogram of your samples with the true density of Y
 can you guys help me to solve this problem in mathlab
Y is an exponential random variable with rate param 1. Assume eter 2. (1) Generate 1000 samples from this exponential distribution using inverse transform method (2) Compare the histogram of your samples with the true density of Y.
Y is an exponential random variable with rate param 1. Assume eter 2. (1) Generate 1000 samples from this exponential distribution using inverse transform method (2) Compare the histogram of your...
can you guys help me to solve this problem in mathlab
Y is an exponential random variable with rate param 1. Assume eter 2. (1) Generate 1000 samples from this exponential distribution using inverse transform method (2) Compare the histogram of your samples with the true density of Y.
Y is an exponential random variable with rate param 1. Assume eter 2. (1) Generate 1000 samples from this exponential distribution using inverse transform method (2) Compare the histogram of your...
 [25 points] Problem 4 - CDF Inversion Sampling ers coming from the U(0, 1) distribution into In notebook 12, we looked at one method many pieces of statistical software use to turn pseudorandom those with a normal distribution. In this problem we examine another such method. a) Simulating an Exponential i) The exponential distribution has pdf f(x) = le-ix for x > 0. Use the following markdown cell to compute by hand the cdf of the exponential. ii) The cdf...
 Python 3.7 please help
please use central limit theory
In this problem you will verify the Central Limit Theorem (CLT) which states that averages, from repeated random samples of any distribution, follow a normal distribution 1. (5 points) Draw a random sample of 5,000 random numbers from a uniform distribution X ~U (20,80] and store them into a vector called xy and plot a histogram of these 5,000 numbers 2. (5 points) Draw a random sample of 5,000 random numbers...
Python 3.7 please help
please use central limit theory
In this problem you will verify the Central Limit Theorem (CLT) which states that averages, from repeated random samples of any distribution, follow a normal distribution 1. (5 points) Draw a random sample of 5,000 random numbers from a uniform distribution X ~U (20,80] and store them into a vector called xy and plot a histogram of these 5,000 numbers 2. (5 points) Draw a random sample of 5,000 random numbers...
 using matlab
Perform the following using Matlab For an additive Gaussian noise: a. Generate 4000 samples with mean value of 3 and variance of 9. b. Plot the sample values using two different ways. c. Determine the actual mean, variance, and standard deviation. d. Determine the median, mode, and range. e. Sketch the histogram. tle- enerate and plot the probability density function (pdf) and its corresponding cumulative distribution function (cdf) ror he M For the following two signals: / and...
using matlab
Perform the following using Matlab For an additive Gaussian noise: a. Generate 4000 samples with mean value of 3 and variance of 9. b. Plot the sample values using two different ways. c. Determine the actual mean, variance, and standard deviation. d. Determine the median, mode, and range. e. Sketch the histogram. tle- enerate and plot the probability density function (pdf) and its corresponding cumulative distribution function (cdf) ror he M For the following two signals: / and...
Most questions answered within 3 hours.
-
(63
#14)
which of the following statments best describes how chamging
the concentration of the substances...
asked 42 minutes ago -
In the following reaction, which element is undergoing
oxidation: Na2SO3 + N2O --> N2 + Na2SO4...
asked 1 hour ago -
Which of the following pairs of ions have the same electron
configuration?
I: Br− and Se2−...
asked 4 hours ago -
The Foremost Composite Materials Company is planning a two-day
sales conference for October 19-20. The conference...
asked 4 hours ago -
3) Illustrate the observed pattern of relatedness of organisms
versus adaptations to specific conditions. This means...
asked 4 hours ago -
In winter a lake has a 0.35 m thick ice layer over 1.10 m of
water....
asked 5 hours ago -
Assuming the following has been encrypted with a Vigenere cipher
below, use the method(s) and assumptions...
asked 6 hours ago -
How would I use switch statements to write a program that will
take an input of...
asked 5 hours ago -
Imagine a reaction in which methane gas combusts at a constant
pressure of 1 atm and...
asked 6 hours ago -
Two parallel wires (each 12 m in length) are separated by a
distance of 0.065 m...
asked 6 hours ago -
Suppose there were three masses at the corner of uniform
equilateral triangle. The masses are m1...
asked 6 hours ago -
Situation: A building that is 618 m above the ground floor. How
many times would a...
asked 6 hours ago