
Calculate the GDP deflator and the percentage inflation rate from year 1 to year 2 by using year 1 as the base year. Next, do the same calculations by using the chain-weighting method.
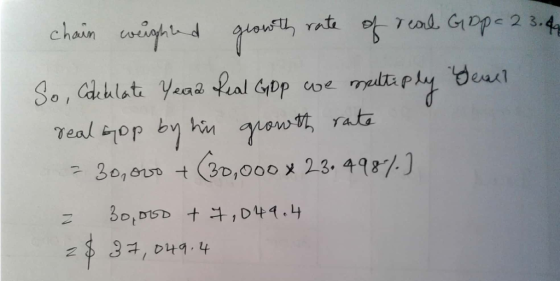
The chain-weighting growth rate was given: 23.498%
Homework Answers
To calculate gdp deflator we need to find out nominal and real
gdp .by using gdp deflator we can find out inflation 

Add Answer to:
Calculate the GDP deflator and the percentage inflation rate from year 1 to year 2 by...
In year 1 and year 2, an economy produces computers and bread. No intermediate goods. In...
In year 1 and year 2, an economy produces computers and bread. No intermediate goods. In year 1, 20 computers are produced and sold each for $1000. In year 2, 25 computers were sold at $1500 each. In year 1, 10,000 loaves of bread are sold at a price of $1 each. And in year 2, 12,000 loaves are sold at a price of $1.1 each. (a) Calculate nominal GDP in each year. (b) Find the growth rate of nominal...
1. Explain why experimentation is difficult in macroeconomics. And, suppose that you had speed powers to...
 1. Explain why experimentation is difficult in macroeconomics. And, suppose that you had speed powers to travel back in time to the Great Depression. What experiment would you like to run on the U.S. economy and why? 2. Assume an economy where there are two producers: a wheat and bread producer. In a given year, the wheat producer grows 30 million bushels of wheat of which 25 million bushels are sold to the bread producer at $3 per bushel, and...
GDP Inflation Deflator Rate YEAR CPI GDP %GDP | Real GDP | %RGDP (%CPI) |(2015-100) 2012...
 GDP Inflation Deflator Rate YEAR CPI GDP %GDP | Real GDP | %RGDP (%CPI) |(2015-100) 2012 231.2 95.43 1619 2013 234.72 97.11 16785 2014 236.27 98.94 17522 2015 237.83 100.00 18219 2016 242.7 01.09 1870 2017 247.91 103.02 19485 1. Calculate the annual inflation rate using the CPI. 2. Calculate the annual GDP growth rate using the GDP. 3. Explain how the inflation rate and the GDP growth have been moved. 4. Calculate the real GDP using GDP deflator by...
Based on the table below, calculate nominal GDP, real GDP, the GDP deflator, and the inflation...
 Based on the table below, calculate nominal GDP, real GDP, the GDP deflator, and the inflation rate in each year and fill in the missing parts of the table. Use 2014 as the base year. Instructions: Round nominal and real GDP values to two decimal places. Round GDP deflator and inflation rate values to the nearest whole number. Price of Quantity of Price of orange ($) Quantity of oranges 700 beach balls beach ball Nominal GDP ($) Real GDP ($)...
Based on the table below, calculate nominal GDP, real GDP, the GDP deflator, and the inflation...
 Based on the table below, calculate nominal GDP, real GDP, the GDP deflator, and the inflation rate in each year and fill in the missing parts of the table. Use 2014 as the base year. Instructions: Round nominal and real GDP values to two decimal places. Round GDP deflator and inflation rate values to the nearest whole number.
1. Year Nominal GDP GDP Price deflator Real GDP Inflation Rate
1. Year Nominal GDP GDP Price deflator Real GDP Inflation Rate Growth Rate 2008 $14,833.60 99.23 -- -- 2009 14,417.90 100.00 2010 14,779.40 101.21 2011 15,052.40 103.20 2012 15,470.70 105.00 2013 15,759.00 106.59 2014 17,420.70 108.27 2015 18,287.20 110.01 2016 18,905.50 112.08 2017 19,738.90 114.27 a. Fill in the blanks in the table above and show your work. b. Over this time period, does inflation...
1. In years 1 and 2, there are 2 goods produced in a given economy, sausages...
 1. In years 1 and 2, there are 2 goods produced in a given economy, sausages and pens. In year 1, 10,000 sausages are produced and sold at $2 each, and in year 2, 20,000 sausages are produced and sold at $2.10 each. In year 1, 15,000 pens are sold for $2 dollars each and in year 2, 48,000 pens are sold for $3 each a) Calculate nominal GDP in years 1 and 2. b) Calculate real GDP in years...
Macroeconomics
In year 1 and 2, there are two products produced in a given economy, smartphones and earphones. Suppose there are no intermediate goods. In year 1, 4,000 smartphones and 2,000 earphones are produced and sold at $2,000 and $200 each, respectively. However, due to an earthquake in year 2, some production lines are destroyed and the production of smartphones and earphones falls to 1,000 and 1,500 units, respectively. However, the price of each pair of smartphones doubled and the price...
Given the following data on the table calculate: the GDP deflator for each year 2014,2015 and...
Given the following data on the table calculate: the GDP deflator for each year 2014,2015 and 2016. Show clearly your calculations (10%) the inflation rate between 2014-2015 and 2015-2016. Show clearly your calculations (10%) (€ million) 2014 2015 2016 Nominal GDP 4,650,000 4,930,000 6,310,000 Real GDP 5,800,000 6,550,000 7,300,200
Consider an economy that produces and consumes coffee, bread and auto- mobiles. In the following table,...
 Consider an economy that produces and consumes coffee, bread and auto- mobiles. In the following table, we have data for two different years. The first 2 questions refer to this table. Price of 1 Automobile Price of 1 loaf of Bread Price of 1 cup of Coffee Number of Automobiles Produced Number of Loaves of Bread Produced Number of Cups of Coffee Produced Year 2018 $30,000 $1.50 $2.00 1000 400,000 100,000 Year 2019 $31,000 $1.60 $2.20 1100 400,000 105,000 1....
 1. Explain why experimentation is difficult in macroeconomics. And, suppose that you had speed powers to travel back in time to the Great Depression. What experiment would you like to run on the U.S. economy and why? 2. Assume an economy where there are two producers: a wheat and bread producer. In a given year, the wheat producer grows 30 million bushels of wheat of which 25 million bushels are sold to the bread producer at $3 per bushel, and...
 GDP Inflation Deflator Rate YEAR CPI GDP %GDP | Real GDP | %RGDP (%CPI) |(2015-100) 2012 231.2 95.43 1619 2013 234.72 97.11 16785 2014 236.27 98.94 17522 2015 237.83 100.00 18219 2016 242.7 01.09 1870 2017 247.91 103.02 19485 1. Calculate the annual inflation rate using the CPI. 2. Calculate the annual GDP growth rate using the GDP. 3. Explain how the inflation rate and the GDP growth have been moved. 4. Calculate the real GDP using GDP deflator by...
 Based on the table below, calculate nominal GDP, real GDP, the GDP deflator, and the inflation rate in each year and fill in the missing parts of the table. Use 2014 as the base year. Instructions: Round nominal and real GDP values to two decimal places. Round GDP deflator and inflation rate values to the nearest whole number. Price of Quantity of Price of orange ($) Quantity of oranges 700 beach balls beach ball Nominal GDP ($) Real GDP ($)...
 1. In years 1 and 2, there are 2 goods produced in a given economy, sausages and pens. In year 1, 10,000 sausages are produced and sold at $2 each, and in year 2, 20,000 sausages are produced and sold at $2.10 each. In year 1, 15,000 pens are sold for $2 dollars each and in year 2, 48,000 pens are sold for $3 each a) Calculate nominal GDP in years 1 and 2. b) Calculate real GDP in years...
 Consider an economy that produces and consumes coffee, bread and auto- mobiles. In the following table, we have data for two different years. The first 2 questions refer to this table. Price of 1 Automobile Price of 1 loaf of Bread Price of 1 cup of Coffee Number of Automobiles Produced Number of Loaves of Bread Produced Number of Cups of Coffee Produced Year 2018 $30,000 $1.50 $2.00 1000 400,000 100,000 Year 2019 $31,000 $1.60 $2.20 1100 400,000 105,000 1....
Most questions answered within 3 hours.
-
What mechanisms Drive speciation??
(I.e. what was Dawins theory on the orgin of species, and how...
asked 51 minutes ago -
The manager at a car assembly plant believes that the mean
assembly time for a car...
asked 1 hour ago -
Which of the following is true of electron capture?
A) It decreases the nuclide's mass number...
asked 3 hours ago -
Assuming an efficiency of 43.10%, calculate the actual yield of
magnesium nitrate formed from 114.9 g...
asked 3 hours ago -
The highly pathogenic bacterium Clostridium
perfringens causes gangrene, a disease that results in the
destruction of...
asked 5 hours ago -
In the context of situation analysis, which of the following is
a category for analysis in...
asked 5 hours ago -
In a study of the gas phase decomposition of sulfuryl chloride
at 600 K SO2Cl2(g)SO2(g) +...
asked 5 hours ago -
75 g of 2-propanol (C3H8O) and 25 g of pentane are mixed in a
200 mL...
asked 5 hours ago -
The 2800-turn coil in a dc motor has an area per turn of 1.1 ×
10-2...
asked 5 hours ago -
Draw a combinational logic circuit diagram with a symbol inside
the box for two I/P of...
asked 5 hours ago -
The cliché we use quite a lot in finance is: there is a need to
maximize...
asked 6 hours ago -
In class we discussed the addition of HCl to alpha pinene. Would
you expect one or...
asked 6 hours ago