Construct a simulated 1H NMR spectrum, including proton integrations, for CH3CHCl2. Drag the appropriate splitting patterns...
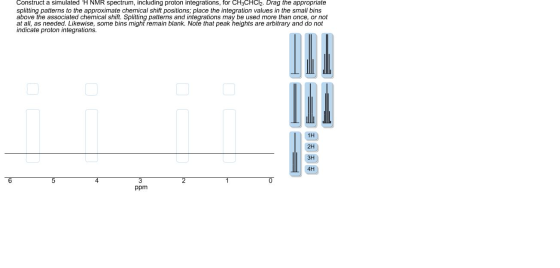
Construct a simulated 1H NMR spectrum, including proton integrations, for CH3CHCl2. Drag the appropriate splitting patterns to the approximate chemical shift positions; place the integration values in the small bins above the associated chemical shift. Splitting patterns and integrations may be used more than once, or not at all, as needed. Likewise, some bins might remain blank. Note that peak heights are arbitrary and do not indicate proton integrations.
Homework Answers
1H NMR Spectroscopy:
• Nuclear magnetic resonance spectroscopy is one of the techniques in analytical chemistry that is widely used to determine the purity of a sample and also to predict the structure of the organic compounds.
•  spectroscopy is phenominal that it observes when the frequency of the nuclei of atoms (sample) resonate with the frequency of the rotating magnetic field.
•  Spectroscopy determines the different types of hydrogen atoms (chemically non-equivalent hydrogen atoms) present in a molecule.
1H NMR Spin-Spin Coupling Patterns:
Number of neighboring hydrogen atoms (chemically non-equivalent) n | Number of peaks ( | Splitting Name | Peak heights ratio |
0 | 1 | Singlet |
|
1 | 2 | Doublet |
|
2 | 3 | Triplet |
|
3 | 4 | Quartet |
|
 )
)


This technique is used to compare the obtained product to the expected product in a reaction mixture.
The given organic compound is 1,1-dichloroethane. The structure of this compound is shown below.


In this structure, there are two non-equivalent protons present.
For methyl proton , the number of adjacent hydrogen atoms is 1. Therefore, this proton will show a doublet (around 2ppm) in the 1H NMR spectrum.
For a chlorine-substituted proton , the number of adjacent hydrogen atoms is 3. Therefore, this proton will show a quartet (around 5.5ppm) in the 1H NMR spectrum.
Therefore, the 1H NMR spectrum for the given compound is shown below.

The 1H NMR spectrum for the given compound is shown below.
Add Answer to:
Construct a simulated 1H NMR spectrum, including proton integrations, for CH3CHCl2. Drag the appropriate splitting patterns...
Construct a simulated 1H NMR spectrum, including proton integrations, for CH3CHCl2. Drag the appropriate splitting patterns...
 Construct a simulated 1H NMR spectrum, including proton integrations, for CH3CHCl2. Drag the appropriate splitting patterns to the approximate chemical shift positions; place the integration values in the small bins above the associated chemical shift. Splitting patterns and integrations may be used more than once, or not at all, as needed. Likewise, some bins might remain blank. Note that peak heights are arbitrary and do not indicate proton integrations.
Construct a simulated H NMR spectrum, including proton integrations, for CH3CHCl2. Drag the appropriate splitting patterns...
 Construct a simulated H NMR spectrum, including proton integrations, for CH3CHCl2. Drag the appropriate splitting patterns to the approximate chemical shift positions; place the integration values in the small bins above the associated chemical shift. Splitting patterns and integrations may be used more than once, or not at all, as needed. Likewise, some bins might remain blank. Note that peak heights are arbitrary and do not indicate proton integrations.
Construct a simulated 1H NMR spectrum for the given structural formula. Drag the appropriate splitting patterns...
 Construct a simulated 1H NMR spectrum for the given structural
formula. Drag the appropriate splitting patterns to the approximate
chemical shift positions; place the integration values in the small
bins above the associated chemical shift. Splitting patterns and
integrations may be used more than once, or not at all, as needed.
Likewise, some bins might remain blank. Note that peak heights are
arbitrary and do not indicate proton integrations.
Construct a simulated 1H NMR spectrum for the given structural
formula. Drag the appropriate splitting patterns to the approximate
chemical shift positions; place the integration values in the small
bins above the associated chemical shift. Splitting patterns and
integrations may be used more than once, or not at all, as needed.
Likewise, some bins might remain blank. Note that peak heights are
arbitrary and do not indicate proton integrations.
Construct a simulated 1H NMR spectrum, including proton integrations, for CH3OC(CH2OCH3)3 (see Hint). Drag the appropriate...
 Construct a simulated 1H NMR spectrum, including proton
integrations, for CH3OC(CH2OCH3)3 (see Hint). Drag the appropriate
splitting patterns to the approximate chemical shift positions;
place the integration values in the small bins above the associated
chemical shift. Splitting patterns and integrations may be used
more than once, or not at all, as needed. Likewise, some bins might
remain blank. Note that peak heights are arbitrary and do not
indicate proton integrations.
Construct a simulated 1H NMR spectrum, including proton
integrations, for CH3OC(CH2OCH3)3 (see Hint). Drag the appropriate
splitting patterns to the approximate chemical shift positions;
place the integration values in the small bins above the associated
chemical shift. Splitting patterns and integrations may be used
more than once, or not at all, as needed. Likewise, some bins might
remain blank. Note that peak heights are arbitrary and do not
indicate proton integrations.
Construct a simulated 1H NMR spectrum, including proton integrations, for CH3OC(CH2OCH3)3) (see Hint). Drag the appropriate...
 Construct a simulated 1H NMR spectrum, including proton integrations, for CH3OC(CH2OCH3)3) (see Hint). Drag the appropriate splitting patterns to the approximate chemical shift positions; place the integration values in the small bins above the associated chemical shift. Splitting patterns and integrations may be used more than once, or not at all, as needed. Likewise, some bins might remain blank. Note that peak heights are arbitrary and do not indicate proton integrations.
Construct a simulated 1H NMR spectrum, including proton integrations, for CH3OC(CH2OCH3)3 (see Hint). Drag the appropriate...
Construct a simulated 1H NMR spectrum, including proton integrations, for CH3OC(CH2OCH3)3 (see Hint). Drag the appropriate splitting patterns to the approximate chemical shift positions; place the integration values in the small bins above the associated chemical shift. Splitting patterns and integrations may be used more than once, or not at all, as needed. Likewise, some bins might remain blank. Note that peak heights are arbitrary and do not indicate proton integrations.
NMR for CH3OC(CH2OCH3)3 Construct a simulated 1H NMR spectrum, Including proton Integrations, for CH3OC(CH2OCH3)3 (see Hint)....
 NMR for CH3OC(CH2OCH3)3
Construct a simulated 1H NMR spectrum, Including proton Integrations, for CH3OC(CH2OCH3)3 (see Hint). Drag the appropriate splitting patterns to the approximate chemical shift positions; place the integration values in the small bins above the associated chemical shift. Splitting patterns and integrations may be used more than once, or not at all, as needed. Likewise, some bins might remain blank. Note that peak heights are arbitrary and do not indicate proton integrations.
NMR for CH3OC(CH2OCH3)3
Construct a simulated 1H NMR spectrum, Including proton Integrations, for CH3OC(CH2OCH3)3 (see Hint). Drag the appropriate splitting patterns to the approximate chemical shift positions; place the integration values in the small bins above the associated chemical shift. Splitting patterns and integrations may be used more than once, or not at all, as needed. Likewise, some bins might remain blank. Note that peak heights are arbitrary and do not indicate proton integrations.
Construct a simulated 1H NMR spectrum for the given structural formula.
 Construct a simulated 1H NMR spectrum for the given structural formula. Drag the appropriate splitting patterns to the approximate chemical shift positions; placethe integration values in the small bins above the associated chemical shift. Splitting patterns and integrations may be used more than once, or not at all, asneeded. Note that peak heights are arbitrary and do not indicate proton integrations.
Mapf Chemistry Roberts & Company Publishers anic presented by Saping Loarning Construct a simulated 'H NMR...
 Mapf Chemistry Roberts & Company Publishers anic presented by Saping Loarning Construct a simulated 'H NMR spectrum, including proton integrations, for CICH-CHCl2. Drag the appropriate ing patterns to the approximate chemical shift positions; place the integration values in the smail bins above the associated chemical shift. Splitting patterns and integrations may be used more than once, or not at all, as needed. Likewise, some bins might remain biank. Note that peak heights are arbitrary and do not indicate proton integrations...
Construct a simulated 1H NMR spectrum for methyl propanoate by dragging and dropping the appropriate splitting...
 Construct a simulated 1H NMR spectrum for methyl propanoate by
dragging and dropping the appropriate splitting patterns into the
boxes on the chemical shift baseline, and by dragging integration
values into the small box above each signal. Items may be used more
than once. Peak heights do not represent integration.
Construct a simulated 1H NMR spectrum for methyl propanoate by dragging and dropping the appropriate splitting patterns into the boxes on the chemical shift baseline, and by dragging integration values...
Construct a simulated 1H NMR spectrum for methyl propanoate by
dragging and dropping the appropriate splitting patterns into the
boxes on the chemical shift baseline, and by dragging integration
values into the small box above each signal. Items may be used more
than once. Peak heights do not represent integration.
Construct a simulated 1H NMR spectrum for methyl propanoate by dragging and dropping the appropriate splitting patterns into the boxes on the chemical shift baseline, and by dragging integration values...
 Construct a simulated 1H NMR spectrum, including proton integrations, for CH3CHCl2. Drag the appropriate splitting patterns to the approximate chemical shift positions; place the integration values in the small bins above the associated chemical shift. Splitting patterns and integrations may be used more than once, or not at all, as needed. Likewise, some bins might remain blank. Note that peak heights are arbitrary and do not indicate proton integrations.
 Construct a simulated H NMR spectrum, including proton integrations, for CH3CHCl2. Drag the appropriate splitting patterns to the approximate chemical shift positions; place the integration values in the small bins above the associated chemical shift. Splitting patterns and integrations may be used more than once, or not at all, as needed. Likewise, some bins might remain blank. Note that peak heights are arbitrary and do not indicate proton integrations.
 Construct a simulated 1H NMR spectrum for the given structural
formula. Drag the appropriate splitting patterns to the approximate
chemical shift positions; place the integration values in the small
bins above the associated chemical shift. Splitting patterns and
integrations may be used more than once, or not at all, as needed.
Likewise, some bins might remain blank. Note that peak heights are
arbitrary and do not indicate proton integrations.
Construct a simulated 1H NMR spectrum for the given structural
formula. Drag the appropriate splitting patterns to the approximate
chemical shift positions; place the integration values in the small
bins above the associated chemical shift. Splitting patterns and
integrations may be used more than once, or not at all, as needed.
Likewise, some bins might remain blank. Note that peak heights are
arbitrary and do not indicate proton integrations.
 Construct a simulated 1H NMR spectrum, including proton
integrations, for CH3OC(CH2OCH3)3 (see Hint). Drag the appropriate
splitting patterns to the approximate chemical shift positions;
place the integration values in the small bins above the associated
chemical shift. Splitting patterns and integrations may be used
more than once, or not at all, as needed. Likewise, some bins might
remain blank. Note that peak heights are arbitrary and do not
indicate proton integrations.
Construct a simulated 1H NMR spectrum, including proton
integrations, for CH3OC(CH2OCH3)3 (see Hint). Drag the appropriate
splitting patterns to the approximate chemical shift positions;
place the integration values in the small bins above the associated
chemical shift. Splitting patterns and integrations may be used
more than once, or not at all, as needed. Likewise, some bins might
remain blank. Note that peak heights are arbitrary and do not
indicate proton integrations.
 Construct a simulated 1H NMR spectrum, including proton integrations, for CH3OC(CH2OCH3)3) (see Hint). Drag the appropriate splitting patterns to the approximate chemical shift positions; place the integration values in the small bins above the associated chemical shift. Splitting patterns and integrations may be used more than once, or not at all, as needed. Likewise, some bins might remain blank. Note that peak heights are arbitrary and do not indicate proton integrations.
 NMR for CH3OC(CH2OCH3)3
Construct a simulated 1H NMR spectrum, Including proton Integrations, for CH3OC(CH2OCH3)3 (see Hint). Drag the appropriate splitting patterns to the approximate chemical shift positions; place the integration values in the small bins above the associated chemical shift. Splitting patterns and integrations may be used more than once, or not at all, as needed. Likewise, some bins might remain blank. Note that peak heights are arbitrary and do not indicate proton integrations.
NMR for CH3OC(CH2OCH3)3
Construct a simulated 1H NMR spectrum, Including proton Integrations, for CH3OC(CH2OCH3)3 (see Hint). Drag the appropriate splitting patterns to the approximate chemical shift positions; place the integration values in the small bins above the associated chemical shift. Splitting patterns and integrations may be used more than once, or not at all, as needed. Likewise, some bins might remain blank. Note that peak heights are arbitrary and do not indicate proton integrations.
 Mapf Chemistry Roberts & Company Publishers anic presented by Saping Loarning Construct a simulated 'H NMR spectrum, including proton integrations, for CICH-CHCl2. Drag the appropriate ing patterns to the approximate chemical shift positions; place the integration values in the smail bins above the associated chemical shift. Splitting patterns and integrations may be used more than once, or not at all, as needed. Likewise, some bins might remain biank. Note that peak heights are arbitrary and do not indicate proton integrations...
 Construct a simulated 1H NMR spectrum for methyl propanoate by
dragging and dropping the appropriate splitting patterns into the
boxes on the chemical shift baseline, and by dragging integration
values into the small box above each signal. Items may be used more
than once. Peak heights do not represent integration.
Construct a simulated 1H NMR spectrum for methyl propanoate by dragging and dropping the appropriate splitting patterns into the boxes on the chemical shift baseline, and by dragging integration values...
Construct a simulated 1H NMR spectrum for methyl propanoate by
dragging and dropping the appropriate splitting patterns into the
boxes on the chemical shift baseline, and by dragging integration
values into the small box above each signal. Items may be used more
than once. Peak heights do not represent integration.
Construct a simulated 1H NMR spectrum for methyl propanoate by dragging and dropping the appropriate splitting patterns into the boxes on the chemical shift baseline, and by dragging integration values...
Most questions answered within 3 hours.
-
Accent Software faces the following conditions. All of these
support Accent’s use of a market-penetration pricing...
asked 40 minutes ago -
A mathematically inclined friend emails you the following
instructions: "Meet me in the cafeteria the first...
asked 42 minutes ago -
A monopoly sells in two countries . The demand curves in the two
countries are p1...
asked 1 hour ago -
A .15kg rubber ball is bounced off a wall. Before hitting the
wall, the ball moves...
asked 2 hours ago -
A manufacturing company preparing to build a new plant is
considering three potential locations for it....
asked 2 hours ago -
B. If compound Y has approximately the same values of solubility
in toluene as compound X,...
asked 3 hours ago -
Oscar Inc. has inventory in Japan valued at 39,051,000 Yen one
year ago. One year ago...
asked 3 hours ago -
If Canada suffered from "fundamental disequilibrium," and its
government choose not to devalue its currency, a...
asked 3 hours ago -
4. How many input & output Key Value Pairs are passed into,
and emitted out of...
asked 3 hours ago -
Why would your heart not function well if constructed of
skeletal muscle? What is the particular...
asked 3 hours ago -
Please respond to this essay question in full essay form for
Chemistry 1102 Organic and Biochemistry:...
asked 3 hours ago -
Determine the head loss and velocity of flow in a water supply main
of 15.0 cm...
asked 3 hours ago