04 Categorical Variables: Problem 16
04 Categorical Variables: Problem 16
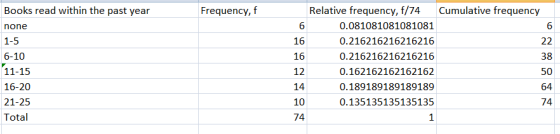
Complete the table below
| Books read within the past year | Frequency | Relative Frequency | Cumulative Frequency |
|---|---|---|---|
| none | 6 | ||
| 1-5 | 0.216216216216216 | ||
| 6-10 | 16 | ||
| 11-15 | 0.162162162162162 | ||
| 16-20 | 14 | ||
| 21-25 | 10 | ||
| Total | 1 |
Note: You can ean partial credit on this problem.
Homework Answers
Let N shows the total of frequency. The frequencies for interval 1-5 and 11-15 are 0.216216216216216N and 0.162162162162162N respectively.
Now,
6+ 0.216216216216216N +16+0.162162162162162N+14+10 = N
0.621621621621622N = 46
N = 46 / 0.621621621621622 = 73.999999999999954956521739130462
That in N is 74.
Now frequency for interval 1-5 is
0.216216216216216 *74 = 15.999999999999984
That is frequency of the interval 1-5 is 16.
Now frequency for interval 11-15 is
0.162162162162162*74 = 11.999999999999988
That is frequency of the interval 11-15 is 12.
Following is the completed table:
(3 points) Complete the table below Books read within the past year Frequency Relative Frequency Cumulative...
 (3 points) Complete the table below Books read within the past year Frequency Relative Frequency Cumulative Relative Frequency none 1-5 6- 10 11-15 16- 20 21 -25 Total 0.166666666666667 0.2 її
AWO3. Problem 4 Prev Up Next (1 pt) Complete the table below ooks read within the...
 AWO3. Problem 4 Prev Up Next (1 pt) Complete the table below ooks read within the past year none 0-4 Frequency Relative Frequency 2 5 9 10 14 15 19 20-25 total 0.297297297297297 10 37 Note: You can eam partial credit on this problem
Books read within the past year Frequency Relative Frequency none 0-4 5-9 10 14 15 19...
 Books read within the past year Frequency Relative Frequency none 0-4 5-9 10 14 15 19 20 25 total 12 14 0.171875 14 10 64
04 Linear systems: Problem 16 Previous Problem Problem List Next Problem (1 point) Find a and...
 04 Linear systems: Problem 16 Previous Problem Problem List Next Problem (1 point) Find a and b such that Note: You can earn partial credit on this problem. Preview My Answers Submit Answers
1. Fill in the missing values in the following table of relative frequency. I am stuck...
1. Fill in the missing values in the following table of relative frequency. I am stuck on this question since I was not given the sample size. If someone could help me that would be awesome! Class Frequency Relative Frequency Cumulative Relative Frequency 1 to 5 14 0.10 0.10 6 to 10 0.15 11 to 15 21 16 to 20 28 21 to 25 0.35 26 to 30 1.00
Complete the table and graph the cumulative relative frequency of heads MR. Harrison tossed a coin 25 times resulting i...
 Complete the table and graph the cumulative relative frequency
of heads
MR. Harrison tossed a coin 25 times resulting in 10 tails. Complete the result in the following table and graph the commulative relatiove frequency of he Commulative relative frequency of H Commulative frequency Toss Number outcome(H or T) 1 2 3 4 5 6 7 8 9 10 11 12 13 14 15 16 17 18 19 20
MR. Harrison tossed a coin 25 times resulting in 10 tails....
Complete the table and graph the cumulative relative frequency
of heads
MR. Harrison tossed a coin 25 times resulting in 10 tails. Complete the result in the following table and graph the commulative relatiove frequency of he Commulative relative frequency of H Commulative frequency Toss Number outcome(H or T) 1 2 3 4 5 6 7 8 9 10 11 12 13 14 15 16 17 18 19 20
MR. Harrison tossed a coin 25 times resulting in 10 tails....
histogram ogive frequency polygon frequency table 00% Redo AutoSum Sort A-Z Sort Z-A Gallery Toolbox Zoom...
 histogram ogive frequency polygon frequency
table
00% Redo AutoSum Sort A-Z Sort Z-A Gallery Toolbox Zoom Help ste Format n Save Print Import Co 21318 35 24 3 19 25 4923 14 19 17 4 21 5 11 6 20 713 22 25 18 8 11 9 16 17 18 15 28 25 10 1827 20 16 112 Tasks 1. Complete the fequency table with 6 classes 13 14 15 Class Limit Class Boundarles mldpoint frequency cumulative relative frequency frequency...
histogram ogive frequency polygon frequency
table
00% Redo AutoSum Sort A-Z Sort Z-A Gallery Toolbox Zoom Help ste Format n Save Print Import Co 21318 35 24 3 19 25 4923 14 19 17 4 21 5 11 6 20 713 22 25 18 8 11 9 16 17 18 15 28 25 10 1827 20 16 112 Tasks 1. Complete the fequency table with 6 classes 13 14 15 Class Limit Class Boundarles mldpoint frequency cumulative relative frequency frequency...
The following data are for 30 observations involving two categorical variables, and . The categories for are A,...
The following data are for 30 observations involving two categorical variables, and . The categories for are A, B, and C; the categories for are 1 and 2. Observation x y Observation x y 1 A 2 16 B 2 2 B 1 17 C 1 3 B 1 18 B 1 4 C 2 19 C 1 5 B 1 20 B 1 6 C 2 21 C 2 7 B 1 22 B 1 8 C 2 23 C 2 9...
frequency table histogram frequency polygon ogive 100% (?) New Open Save Print Import Copy Paste Format...
 frequency table histogram frequency polygon
ogive
100% (?) New Open Save Print Import Copy Paste Format Undo Redo AutoSum Sort A-Z Sort Z-A Gallery Toolbox Zoom Help Charts SmartArt Gr Word Protein Grams In Fast Food 223 3 25 12 38 22 21 427 27 1429 27 42 34 35 23 12 27 29 15 31 6 30 7 15 57 35 9 35 10 20 11 18 12 24 20 26 19 35 Tasks 1. Complete the fequency table...
frequency table histogram frequency polygon
ogive
100% (?) New Open Save Print Import Copy Paste Format Undo Redo AutoSum Sort A-Z Sort Z-A Gallery Toolbox Zoom Help Charts SmartArt Gr Word Protein Grams In Fast Food 223 3 25 12 38 22 21 427 27 1429 27 42 34 35 23 12 27 29 15 31 6 30 7 15 57 35 9 35 10 20 11 18 12 24 20 26 19 35 Tasks 1. Complete the fequency table...
Example (H.W): You have the following data: 8 6 11 14 10 11 9 7 2...
Example (H.W): You have the following data: 8 6 11 14 10 11 9 7 2 8 9 5 5 5 12 7 8 4 17 8 12 7 8 8 7 10 8 6 9 9 11 16 2 7 4 8 4 4 5 5 9 9 6 6 7 7 9 5 4 5 14 2 9 0 6 1 1 12 11 4 1. Construct a frequency distribution for these data. 2. Develop a relative frequency...
 (3 points) Complete the table below Books read within the past year Frequency Relative Frequency Cumulative Relative Frequency none 1-5 6- 10 11-15 16- 20 21 -25 Total 0.166666666666667 0.2 її
 AWO3. Problem 4 Prev Up Next (1 pt) Complete the table below ooks read within the past year none 0-4 Frequency Relative Frequency 2 5 9 10 14 15 19 20-25 total 0.297297297297297 10 37 Note: You can eam partial credit on this problem
 Books read within the past year Frequency Relative Frequency none 0-4 5-9 10 14 15 19 20 25 total 12 14 0.171875 14 10 64
 04 Linear systems: Problem 16 Previous Problem Problem List Next Problem (1 point) Find a and b such that Note: You can earn partial credit on this problem. Preview My Answers Submit Answers
 Complete the table and graph the cumulative relative frequency
of heads
MR. Harrison tossed a coin 25 times resulting in 10 tails. Complete the result in the following table and graph the commulative relatiove frequency of he Commulative relative frequency of H Commulative frequency Toss Number outcome(H or T) 1 2 3 4 5 6 7 8 9 10 11 12 13 14 15 16 17 18 19 20
MR. Harrison tossed a coin 25 times resulting in 10 tails....
Complete the table and graph the cumulative relative frequency
of heads
MR. Harrison tossed a coin 25 times resulting in 10 tails. Complete the result in the following table and graph the commulative relatiove frequency of he Commulative relative frequency of H Commulative frequency Toss Number outcome(H or T) 1 2 3 4 5 6 7 8 9 10 11 12 13 14 15 16 17 18 19 20
MR. Harrison tossed a coin 25 times resulting in 10 tails....
 histogram ogive frequency polygon frequency
table
00% Redo AutoSum Sort A-Z Sort Z-A Gallery Toolbox Zoom Help ste Format n Save Print Import Co 21318 35 24 3 19 25 4923 14 19 17 4 21 5 11 6 20 713 22 25 18 8 11 9 16 17 18 15 28 25 10 1827 20 16 112 Tasks 1. Complete the fequency table with 6 classes 13 14 15 Class Limit Class Boundarles mldpoint frequency cumulative relative frequency frequency...
histogram ogive frequency polygon frequency
table
00% Redo AutoSum Sort A-Z Sort Z-A Gallery Toolbox Zoom Help ste Format n Save Print Import Co 21318 35 24 3 19 25 4923 14 19 17 4 21 5 11 6 20 713 22 25 18 8 11 9 16 17 18 15 28 25 10 1827 20 16 112 Tasks 1. Complete the fequency table with 6 classes 13 14 15 Class Limit Class Boundarles mldpoint frequency cumulative relative frequency frequency...
 frequency table histogram frequency polygon
ogive
100% (?) New Open Save Print Import Copy Paste Format Undo Redo AutoSum Sort A-Z Sort Z-A Gallery Toolbox Zoom Help Charts SmartArt Gr Word Protein Grams In Fast Food 223 3 25 12 38 22 21 427 27 1429 27 42 34 35 23 12 27 29 15 31 6 30 7 15 57 35 9 35 10 20 11 18 12 24 20 26 19 35 Tasks 1. Complete the fequency table...
frequency table histogram frequency polygon
ogive
100% (?) New Open Save Print Import Copy Paste Format Undo Redo AutoSum Sort A-Z Sort Z-A Gallery Toolbox Zoom Help Charts SmartArt Gr Word Protein Grams In Fast Food 223 3 25 12 38 22 21 427 27 1429 27 42 34 35 23 12 27 29 15 31 6 30 7 15 57 35 9 35 10 20 11 18 12 24 20 26 19 35 Tasks 1. Complete the fequency table...
Most questions answered within 3 hours.
-
Calculate the pH of each of the following solutions.
0.50 M HBr
3.1×10⁻⁴ M KOH
4.2×10⁻⁵...
asked 2 hours ago -
For the year ended December 31, Depot Max’s cost of merchandise
sold was $85,600. Inventory at the...
asked 2 hours ago -
Week 10 - Professional Memo Assignment
Professional Memo Assignment
Your mission for this week, should you...
asked 2 hours ago -
Write a Python program that stores the data for each
player on the team, and it...
asked 2 hours ago -
In
the last 3 months, mike never knows when he is going to get his
allowance...
asked 3 hours ago -
Is Ca(OH)2 a Bronsted base, Lewis base, or both? Why?
asked 3 hours ago -
1A- Why don’t voters complain about U.S. tariffs on imported
sugar?
Because sugar is only a...
asked 3 hours ago -
Cash Payback Period
Primera Banco is evaluating two capital investment proposals for
a drive-up ATM kiosk,...
asked 3 hours ago -
Create a button in Swift (Xcode) that will create a charge,
create a charge using Stripe's...
asked 3 hours ago -
The reaction rate of CO and NO2 in the reaction
CO(g) + NO2(g) → CO2(g) +...
asked 3 hours ago -
Imagine that a chemist puts 6.40 mol each of
C3H8 and O2 in a 1.00-L container...
asked 3 hours ago -
How much money should be invested today in order to have $8340
at the end of...
asked 3 hours ago