The graph below shows the market for office rental space. A $400
per month excise tax is imposed on firms selling office space. D is
the demand curve, S1 is the supply curve in the absence of the tax,
and S2 represents the supply curve that includes the tax.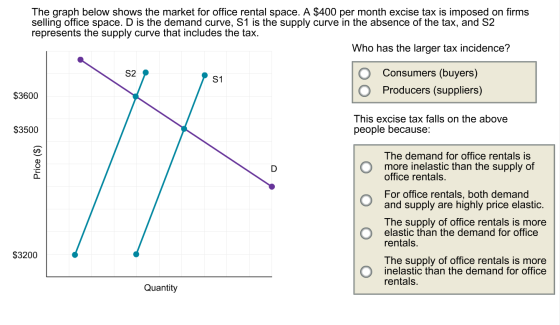
Homework Answers
ans 1
who has the larger tax incidence
b) producers (suppliers)
ans 2
d)the supply of office rentals is more inelastic than the demand for office rentals
burden falls more on producer if supply elasticity is less than demand elasticity
Add Answer to:
The graph below shows the market for office rental space. A $400 per month excise tax...
The graph below shows a hypothetical market for salt. Suppose that an excise or commodity tax...
 The graph below shows a hypothetical market for salt. Suppose that an excise or commodity tax is levied on consumers in an attempt to curb blood pressure problems. Show the effect of the tax by shifting the appropriate curve(s). Who has the larger tax burden? Producers (suppliers) Consumers (buyers) The tax burdens are equal Why is the tax burden as you described in in the question above? Supply is less elastic than demand. Demand is more elastic than supply. Both...
Question 5 1 pts Assuming that a $500 excise tax is imposed in a market. The...
 Question 5 1 pts Assuming that a $500 excise tax is imposed in a market. The consumer share of the actual tax incidence turns out to be $100, while the producers' share of the tax burden turns out to be $400. O This implies that supply is relatively more elastic than demand This implies that demand is relatively more elastic than supply O Tax Burden and elasticity are unrelated concepts.
1-3 please Feel free to use any spaces for scratch work. 1) Consider the excise tax lectured in class. For a given e...
 1-3
please
Feel free to use any spaces for scratch work. 1) Consider the excise tax lectured in class. For a given excise tax, we can correctly predict that consumer tax incidence will be less than producer tax incidence when: a) Both the demand and the supply curves are more inelastic. b) The demand curve is inelastic and the supply curve is elastie. c) The demand curve is elastic and the supply curve is inelastic. d) Both the demand and...
1-3
please
Feel free to use any spaces for scratch work. 1) Consider the excise tax lectured in class. For a given excise tax, we can correctly predict that consumer tax incidence will be less than producer tax incidence when: a) Both the demand and the supply curves are more inelastic. b) The demand curve is inelastic and the supply curve is elastie. c) The demand curve is elastic and the supply curve is inelastic. d) Both the demand and...
Price (dollars per case) The graph shows the supply curve of no-name soda. The government has imposed a sales tax of $2...
 Price (dollars per case) The graph shows the supply curve of no-name soda. The government has imposed a sales tax of $2 per case on no-name soda. The sellers of no-name soda end up paying the entire tax. Draw and label the demand curve for no-name soda. The more the demand, O A. inelastic; the larger is the amount of the tax paid by sellers O B. elastic; the larger is the amount of the tax paid by sellers O...
The graph shows the supply curve of no-name soda. The government has imposed a sales tax...
 The graph shows the supply curve of no-name soda. The government has imposed a sales tax of $2 per case on no-name soda. Price (dollars per case) The sellers of no-name soda end up paying the entire tax. @ O3 Draw and label the demand curve for no-name soda. The more the demand, O A. inelastic; the larger is the amount of the tax paid by sellers O B. elastic; the larger is the amount of the tax paid by...
Consider the market for gasoline, illustrated in the figure to the right.
 Consider the market for gasoline, illustrated in the figure to the right. Suppose the government adds a $1.50 per gallon excise tax on gasoline, which shifts the supply curve from S1 to S2, as illustrated. What is the tax incidence? Consumers pay $ _______ of the tax and producers pay $_______ of the tax. (Enter your responses rounded to two decimal places.) When the demand for a product is more elastic than supply, consumers pay _______ of the tax on the product.
QUESTION 12 Figure: The graph below shows a demand curve and four supply curves 1 Price...
 QUESTION 12 Figure: The graph below shows a demand curve and four supply curves 1 Price Refer to Figure. If a tax is imposed in the above market then which supply curve will have highest deadweight lossi a. S2 Oc. SA. d.53. QUESTION 18 When boats are taxed and sellers of boats are required to pay the tax to the government, a. there is a movement downward and to the right along the demand curve for boats. Ob the quantity...
The graph below shows the market for mandarin oranges in Odin for the month of November...
 The graph below shows the market for mandarin oranges in Odin for the month of November (in thousands of kilos). s Tools Price 100 200 300 400 500 600 700 800 900 0 Quantity per month Suppose that in December the demand of mandarin oranges increases by 250 while the supply increases by 100. a) Draw the new curves D2 and S2 In graph above. Plot only the endpoints of the curve above and position those points on the edges...
The graph below shows demand and supply in the market for airline tickets. The government decides...
 The graph below shows demand and supply in the market for
airline tickets. The government decides to introduce an excise (or
commodity) tax that pushes up the price for consumers from Pe to Pc
and decrease quantity supplied from Qe to Q1 .Use the labeling
below to identify the areas that match the terms indicated. Note
that you may place each letter multiple times, and that some
answers will require moving more than one letter into the bin to
identify...
The graph below shows demand and supply in the market for
airline tickets. The government decides to introduce an excise (or
commodity) tax that pushes up the price for consumers from Pe to Pc
and decrease quantity supplied from Qe to Q1 .Use the labeling
below to identify the areas that match the terms indicated. Note
that you may place each letter multiple times, and that some
answers will require moving more than one letter into the bin to
identify...
The government is considering levying a tax of $60 per unit on suppliers of either concert...
 The government is considering levying a tax of $60 per unit on suppliers of either concert tickets or bus passes. The supply curve for each of these two goods is identical, as you can see on each of the following graphs. The demand for concert tickets is shown by De (on the first graph), and the demand for bus passes is shown by D. (on the second graph). Suppose the government taxes concert tickets. The following graph shows the annual...
 The graph below shows a hypothetical market for salt. Suppose that an excise or commodity tax is levied on consumers in an attempt to curb blood pressure problems. Show the effect of the tax by shifting the appropriate curve(s). Who has the larger tax burden? Producers (suppliers) Consumers (buyers) The tax burdens are equal Why is the tax burden as you described in in the question above? Supply is less elastic than demand. Demand is more elastic than supply. Both...
 Question 5 1 pts Assuming that a $500 excise tax is imposed in a market. The consumer share of the actual tax incidence turns out to be $100, while the producers' share of the tax burden turns out to be $400. O This implies that supply is relatively more elastic than demand This implies that demand is relatively more elastic than supply O Tax Burden and elasticity are unrelated concepts.
 1-3
please
Feel free to use any spaces for scratch work. 1) Consider the excise tax lectured in class. For a given excise tax, we can correctly predict that consumer tax incidence will be less than producer tax incidence when: a) Both the demand and the supply curves are more inelastic. b) The demand curve is inelastic and the supply curve is elastie. c) The demand curve is elastic and the supply curve is inelastic. d) Both the demand and...
1-3
please
Feel free to use any spaces for scratch work. 1) Consider the excise tax lectured in class. For a given excise tax, we can correctly predict that consumer tax incidence will be less than producer tax incidence when: a) Both the demand and the supply curves are more inelastic. b) The demand curve is inelastic and the supply curve is elastie. c) The demand curve is elastic and the supply curve is inelastic. d) Both the demand and...
 Price (dollars per case) The graph shows the supply curve of no-name soda. The government has imposed a sales tax of $2 per case on no-name soda. The sellers of no-name soda end up paying the entire tax. Draw and label the demand curve for no-name soda. The more the demand, O A. inelastic; the larger is the amount of the tax paid by sellers O B. elastic; the larger is the amount of the tax paid by sellers O...
 The graph shows the supply curve of no-name soda. The government has imposed a sales tax of $2 per case on no-name soda. Price (dollars per case) The sellers of no-name soda end up paying the entire tax. @ O3 Draw and label the demand curve for no-name soda. The more the demand, O A. inelastic; the larger is the amount of the tax paid by sellers O B. elastic; the larger is the amount of the tax paid by...
 QUESTION 12 Figure: The graph below shows a demand curve and four supply curves 1 Price Refer to Figure. If a tax is imposed in the above market then which supply curve will have highest deadweight lossi a. S2 Oc. SA. d.53. QUESTION 18 When boats are taxed and sellers of boats are required to pay the tax to the government, a. there is a movement downward and to the right along the demand curve for boats. Ob the quantity...
 The graph below shows the market for mandarin oranges in Odin for the month of November (in thousands of kilos). s Tools Price 100 200 300 400 500 600 700 800 900 0 Quantity per month Suppose that in December the demand of mandarin oranges increases by 250 while the supply increases by 100. a) Draw the new curves D2 and S2 In graph above. Plot only the endpoints of the curve above and position those points on the edges...
 The graph below shows demand and supply in the market for
airline tickets. The government decides to introduce an excise (or
commodity) tax that pushes up the price for consumers from Pe to Pc
and decrease quantity supplied from Qe to Q1 .Use the labeling
below to identify the areas that match the terms indicated. Note
that you may place each letter multiple times, and that some
answers will require moving more than one letter into the bin to
identify...
The graph below shows demand and supply in the market for
airline tickets. The government decides to introduce an excise (or
commodity) tax that pushes up the price for consumers from Pe to Pc
and decrease quantity supplied from Qe to Q1 .Use the labeling
below to identify the areas that match the terms indicated. Note
that you may place each letter multiple times, and that some
answers will require moving more than one letter into the bin to
identify...
 The government is considering levying a tax of $60 per unit on suppliers of either concert tickets or bus passes. The supply curve for each of these two goods is identical, as you can see on each of the following graphs. The demand for concert tickets is shown by De (on the first graph), and the demand for bus passes is shown by D. (on the second graph). Suppose the government taxes concert tickets. The following graph shows the annual...
Most questions answered within 3 hours.
-
. Please give the mechanism for this type of problem. Step by
Step
The toxin that...
asked 2 minutes ago -
If you have a 1M stock solution and you want to dilute 1 :10
with water,...
asked 4 minutes ago -
In a load instruction, the effective address is obtained by
A) Retriving the address from a...
asked 4 minutes ago -
Use the following information to answer this question.
Windswept, Inc. 2017 Income Statement ($ in millions)...
asked 5 minutes ago -
A mutual fund salesperson has arranged to call on four people
tomorrow. Based on past experience...
asked 38 minutes ago -
Let the RV Y has the pdf
f ( y ) = 6 y ( 1...
asked 49 minutes ago -
Question 12
Where should a copy of a private key should be placed so it is...
asked 7 minutes ago -
What is the entropy change to the surroundings when 1 mol of ice
melts in someone's...
asked 26 minutes ago -
Pt1
An electrochemical cell is set up at 25°C based on the overall
reaction represented by...
asked 32 minutes ago -
Explain traveling wave theory. Explain how the peaking of the
wave leads to action potentials and...
asked 23 minutes ago -
If you mixed 35.0 mLmL of 0.100 M Tris-HCl with 65.0
mLmL of 0.200 M Tris-base, what would...
asked 20 minutes ago -
Which force do you think wields a stronger influence over our
ethical behavior – our personal...
asked 26 minutes ago