

Homework Answers

Add Answer to:
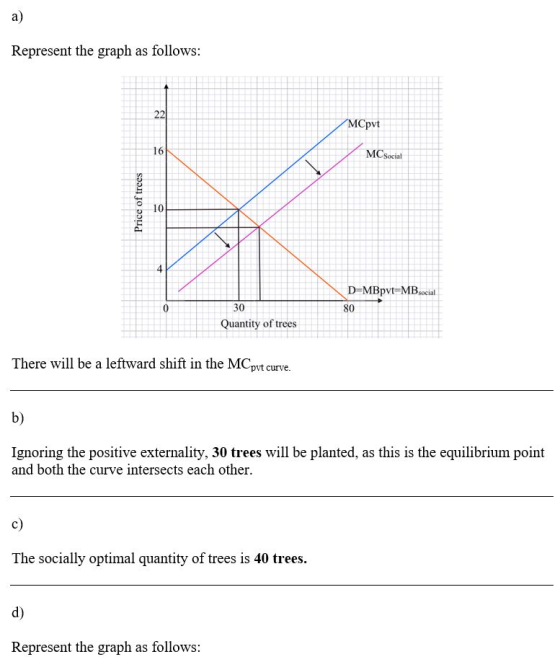
The figure below shows supply and demand for planting trees, based on private costs and benefits....
The figure below shows supply and demand for first-aid training, based on private costs and benefits.
 Problem 18-5 The figure below shows supply and demand for first-aid training, based on private costs and benefits. a. Suppose that the external benefit from first-aid training is worth $6. Graph the social benefit curve for first-aid training that accounts for the external benefit. Instructions: Use the tool provided (MBsociall and plot only the two endpoints across the entire range of output (0 - 30). b. Ignoring the social benefits of training, _______ hours of first-aid training will occur. c. The socially optimal quantity of...
Given the graph, what are these blanks? Problem 18-10 The figure below shows the daily market...
 Given the graph, what are these blanks?
Problem 18-10 The figure below shows the daily market for water skiing permits on El Dorado Lake. Suppose each skier (each permit) causes $4 of damage to the lake. Priceof ski permits(S) · 18 16 14 12 10 Tools «МС social MBocial Date DWLDW oWl2 MB pvt 10 20 30 40 50 60 70 80 90 100 Skiers per day a. Draw the social benefit curve that accounts for the external cost of...
Given the graph, what are these blanks?
Problem 18-10 The figure below shows the daily market for water skiing permits on El Dorado Lake. Suppose each skier (each permit) causes $4 of damage to the lake. Priceof ski permits(S) · 18 16 14 12 10 Tools «МС social MBocial Date DWLDW oWl2 MB pvt 10 20 30 40 50 60 70 80 90 100 Skiers per day a. Draw the social benefit curve that accounts for the external cost of...
3) Assume that the market for energy efficient window installations in San Diego is perfectly competitive. Quarterly inverse supply and inverse demand are: P 1200 3Q (Private MB) P 440Qs (Private...
 3) Assume that the market for energy efficient window installations in San Diego is perfectly competitive. Quarterly inverse supply and inverse demand are: P 1200 3Q (Private MB) P 440Qs (Private MC) neighbors (lowering the overall price of electricity, reducing pollution, and so on) These external benefits to consumers are estimated to be EMB 2Q (the more windows installed, the more external benefit to installing more windows). a) Find the equilibrium price and quantity that will be produced in a...
Supply Social (Private costs + External costs Supply Internal (private Costs) Demand Internal 67 80 Quantity...
 Supply Social (Private costs + External costs Supply Internal (private Costs) Demand Internal 67 80 Quantity of packs of cigarettes measured in millions a. What is the equilibrium price and quantity if this is an unregulated market? b. What is the external cost? (Assume the external cost is the same along the the supply curve) c. What would be an appropriate solution for the government to mitigate this market failure? Be specific d. What would be the outcome of the...
Help! Based on this data, what are c). d). and e). 20 Problem 14-8 The figure...
 Help! Based on this data, what are c). d). and e).
20 Problem 14-8 The figure below presents the demand curve, marginal revenue, and marginal costs facing a 6.25 points Price ($) References Tools 50 45 40 35 30 25 20 15 10 F MC DWL CS CS MR 1 23 4 567 8 9 10 11 Quantity Check my work View previous att c. Determine the efficiency costs (deadweight loss) of monopoly output/pricing Use the tool provided (DWL) to...
Help! Based on this data, what are c). d). and e).
20 Problem 14-8 The figure below presents the demand curve, marginal revenue, and marginal costs facing a 6.25 points Price ($) References Tools 50 45 40 35 30 25 20 15 10 F MC DWL CS CS MR 1 23 4 567 8 9 10 11 Quantity Check my work View previous att c. Determine the efficiency costs (deadweight loss) of monopoly output/pricing Use the tool provided (DWL) to...
I’m so lost, help! thanks. The figure below shows a market in equilibrium. 19 Price (s)...
 I’m so lost, help!
thanks.
The figure below shows a market in equilibrium. 19 Price (s) Tools oints DWL Floor ONDOR References 4 8 12 16 20 24 28 Quantity < Prev 19 of 20 Next > Help Save & Exit Sub 19 a. Draw a price floor at $12. Instructions: Use the tool provided (Floory) to draw the price floor. Place your endpoints at 0-0 and Q-24 The amount of surplus at this price is Book erences The deadweight...
I’m so lost, help!
thanks.
The figure below shows a market in equilibrium. 19 Price (s) Tools oints DWL Floor ONDOR References 4 8 12 16 20 24 28 Quantity < Prev 19 of 20 Next > Help Save & Exit Sub 19 a. Draw a price floor at $12. Instructions: Use the tool provided (Floory) to draw the price floor. Place your endpoints at 0-0 and Q-24 The amount of surplus at this price is Book erences The deadweight...
5) (28 points) Suppose the demand and supply for flu shots are given by pd =...
 5) (28 points) Suppose the demand and supply for flu shots are given by pd = 1200-Q ps = 440 + Q Suppose flu shots generate a positive externality, and the marginal external benefit (MEB) is MEB=60 -0.050. (a) Derive the marginal social benefit (MSB) curve. (b) Draw the Demand, Supply, and MSB curves on the same graph (with P on the vertical axis and Q on the horizontal axis) and clearly indicate the curves in your graph. (c) Calculate...
The U.S. wheat market is shown in the figure below. Suppose the United States wants to...
 The U.S. wheat market is shown in the figure below. Suppose the United States wants to protect its wheat industry by imposing a tariff of $1 per bushel on foreign wheat, which currently sells at the world price of $4 per bushel. Your Graph Score: 0% Price (S) CS 10 PS DWL2 DWL CS World price 20 40 60 80 100 120 140 160 180 Quantity of wheat (millions) a. Use the tool provided (CS) to draw the consumer surplus...
Suppose that leather is sold in a perfectly competitive industry. The industry short-run supply curve (marginal...
Suppose that leather is sold in a perfectly competitive industry. The industry short-run supply curve (marginal cost curve) is P = MC = 3Q. The demand for leather hides is given by Q = 60 − P. a. Find the equilibrium market price and quantity. b. Suppose that the leather tanning releases bad stuff into waterways. The external marginal cost is $5 per unit. Calculate the socially optimal level of output and price for the tanning industry. c. What are...
 Given the graph, what are these blanks?
Problem 18-10 The figure below shows the daily market for water skiing permits on El Dorado Lake. Suppose each skier (each permit) causes $4 of damage to the lake. Priceof ski permits(S) · 18 16 14 12 10 Tools «МС social MBocial Date DWLDW oWl2 MB pvt 10 20 30 40 50 60 70 80 90 100 Skiers per day a. Draw the social benefit curve that accounts for the external cost of...
Given the graph, what are these blanks?
Problem 18-10 The figure below shows the daily market for water skiing permits on El Dorado Lake. Suppose each skier (each permit) causes $4 of damage to the lake. Priceof ski permits(S) · 18 16 14 12 10 Tools «МС social MBocial Date DWLDW oWl2 MB pvt 10 20 30 40 50 60 70 80 90 100 Skiers per day a. Draw the social benefit curve that accounts for the external cost of...
 3) Assume that the market for energy efficient window installations in San Diego is perfectly competitive. Quarterly inverse supply and inverse demand are: P 1200 3Q (Private MB) P 440Qs (Private MC) neighbors (lowering the overall price of electricity, reducing pollution, and so on) These external benefits to consumers are estimated to be EMB 2Q (the more windows installed, the more external benefit to installing more windows). a) Find the equilibrium price and quantity that will be produced in a...
 Supply Social (Private costs + External costs Supply Internal (private Costs) Demand Internal 67 80 Quantity of packs of cigarettes measured in millions a. What is the equilibrium price and quantity if this is an unregulated market? b. What is the external cost? (Assume the external cost is the same along the the supply curve) c. What would be an appropriate solution for the government to mitigate this market failure? Be specific d. What would be the outcome of the...
 Help! Based on this data, what are c). d). and e).
20 Problem 14-8 The figure below presents the demand curve, marginal revenue, and marginal costs facing a 6.25 points Price ($) References Tools 50 45 40 35 30 25 20 15 10 F MC DWL CS CS MR 1 23 4 567 8 9 10 11 Quantity Check my work View previous att c. Determine the efficiency costs (deadweight loss) of monopoly output/pricing Use the tool provided (DWL) to...
Help! Based on this data, what are c). d). and e).
20 Problem 14-8 The figure below presents the demand curve, marginal revenue, and marginal costs facing a 6.25 points Price ($) References Tools 50 45 40 35 30 25 20 15 10 F MC DWL CS CS MR 1 23 4 567 8 9 10 11 Quantity Check my work View previous att c. Determine the efficiency costs (deadweight loss) of monopoly output/pricing Use the tool provided (DWL) to...
 I’m so lost, help!
thanks.
The figure below shows a market in equilibrium. 19 Price (s) Tools oints DWL Floor ONDOR References 4 8 12 16 20 24 28 Quantity < Prev 19 of 20 Next > Help Save & Exit Sub 19 a. Draw a price floor at $12. Instructions: Use the tool provided (Floory) to draw the price floor. Place your endpoints at 0-0 and Q-24 The amount of surplus at this price is Book erences The deadweight...
I’m so lost, help!
thanks.
The figure below shows a market in equilibrium. 19 Price (s) Tools oints DWL Floor ONDOR References 4 8 12 16 20 24 28 Quantity < Prev 19 of 20 Next > Help Save & Exit Sub 19 a. Draw a price floor at $12. Instructions: Use the tool provided (Floory) to draw the price floor. Place your endpoints at 0-0 and Q-24 The amount of surplus at this price is Book erences The deadweight...
 5) (28 points) Suppose the demand and supply for flu shots are given by pd = 1200-Q ps = 440 + Q Suppose flu shots generate a positive externality, and the marginal external benefit (MEB) is MEB=60 -0.050. (a) Derive the marginal social benefit (MSB) curve. (b) Draw the Demand, Supply, and MSB curves on the same graph (with P on the vertical axis and Q on the horizontal axis) and clearly indicate the curves in your graph. (c) Calculate...
 The U.S. wheat market is shown in the figure below. Suppose the United States wants to protect its wheat industry by imposing a tariff of $1 per bushel on foreign wheat, which currently sells at the world price of $4 per bushel. Your Graph Score: 0% Price (S) CS 10 PS DWL2 DWL CS World price 20 40 60 80 100 120 140 160 180 Quantity of wheat (millions) a. Use the tool provided (CS) to draw the consumer surplus...
Most questions answered within 3 hours.
-
The heights in feet of some of the girls of SEU
are: 5.8, 6.1, 5.9, 5.4, 5.6,...
asked 52 seconds ago -
Caspian Sea Drinks is considering the purchase of a new water
filtration system produced by Rube...
asked 5 minutes ago -
Compare and contrast the
social media of Pepsi and Coke? which one is most effective and...
asked 6 minutes ago -
1.
Who initiates a lockout?
Group of answer choices
management
employees
unions
arbitrators
asked 6 minutes ago -
Many celebrities and public figures have Twitter accounts with
large numbers of followers. However, some of...
asked 37 minutes ago -
In #13-16, use the following information. At the 0.01 level of
significance, test the claim that...
asked 17 minutes ago -
Suppose you wanted to make a buffer with pH 3.00. What chemicals
would you grab off...
asked 36 minutes ago -
A 195 g mass attached to a horizontal spring oscillates at a
frequency of 5.20 Hz...
asked 20 minutes ago -
Given the reaction where 1.00 mol H2(g) is burned in excess
O2(g) at 25 °C,
H2(g)...
asked 29 minutes ago -
Elemental phosphorus is produced by the reaction, 2Ca3(PO4)2
+6SiO2 +10C→6CaSiO3 +10CO+P4 Suppose that you have 7.00...
asked 37 minutes ago -
A nationwide survey found that 64% of people in the
Kingdom like Berger. If 3 people...
asked 49 minutes ago -
CYTOGENETIC MAPS VS LINKAGE MAPS
how do you read and extract information from cytogenetic and
linkage...
asked 51 minutes ago