Show how the capital structure of Best Buy has changed over time on a Table and...
Show how the capital structure of Best Buy has changed over time on a Table and a Graph. Does it appear that the company has a stable target debt ratio?
Homework Answers
| (AMOUNT IN $) | |||
| PARTICULARS / YEAR | SHAREHOLDERS EQUITY | LONG TERM DEBT | DEBT TO EQUITY |
| 2019 | 3306 | 1332 | 0.40 |
| 2018 | 3612 | 811 | 0.22 |
| 2017 | 4709 | 1321 | 0.28 |
| 2016 | 4378 | 1339 | 0.31 |
| 2015 | 5000 | 1572 | 0.31 |
| 2014 | 3989 | 1612 | 0.40 |
| 2013 | 3715 | 1153 | 0.31 |
| 2012 | 4366 | 1685 | 0.39 |
| 2011 | 7292 | 711 | 0.10 |
| 2010 | 6964 | 1104 | 0.16 |
The following table shows the Shareholders Equity which comprises of (Share Capital and Reserves) and Long Term Debt ultimately calculation Debt to Equity by the formula
Debt to Equity = Long Term Debt / Shareholders Equity
The chart for all the 3 is given below:
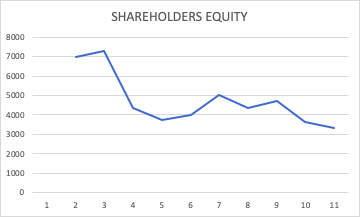
This chart is showing the movement of Shareholders Equity where 1 means Year 2010 and 10 mean year 2019. The chart shows that the Shareholders Equity has come down consistently which shows that the company has not been raising capital and also distributing profits or reinvesting them back into the business which is a good sign.
This is the chart showing movement of Long Term Debt:

In terms of movement of Debt the company was trying to bring the debt down from years 2015 to 2018 however They have increased Debt considerably this year i.e. 2019
The below chart is showing the movement of Debt to Equity:
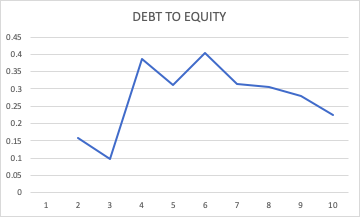
As you would have noticed that the movement of Debt to Equity and Long term Debt has been very identical, however the Equity chart has not moved in alignment with the same. Here if we talk about a target debt to equity, the ratio has fluctuated a lot over the last decade however it has never crossed 0.4 even after reaching that point 3 times in the last 10 years. So even though there isnt a clear target with regard to Debt to Equity being constant the company is surely striving to keep the ratio below 0.40.
So to Summarise, There hasn't been a clear trend with respect to movements in the capital structure, currently the Debt to Equity is at 0.4 which is the highest in the last 5 years showing that the company has taken more debt than raise money through equity and even though this has been the case the company has been able to keep the ratio below 0.40 showing that it atleast has a restrictive barrier with regard to this ratio
Add Answer to:
Show how the capital structure of Best Buy has changed over time on a Table and...
Current target capital structure is 15% debt, 2% preferred stock and 83% common equity. If changed...
Current target capital structure is 15% debt, 2% preferred stock and 83% common equity. If changed to 50% equity and 50% debt (by issuing additional debt, and using proceeds to buy back 33% equity and 2% preferred stock, will the cost of debt change? Or will it remain the same as before this change?
MACROeconomics help needed for Capitalism paper How has society changed over time How has industry changed...
MACROeconomics help needed for Capitalism paper How has society changed over time How has industry changed over time How has trade changed over time
How has public health strategies changed over time?
How has public health strategies changed over time?
Reed Corporation has a capital budget of $2.25 million
Reed Corporation has a capital budget of $2.25 million. The company wants to maintain a target capital structure which is 60% debt and 40% equity. The company forecasts that its net income this year will be $800,000.a. If the firm uses a payout ratio of 25%, what dividend will Reed pay?b. How much will be added to retained earnings?c. If the company wishes to maintain its debt-equity ratio to finance the capital budget, how much debt must the firm issue?d. ...
Remex? (RMX) currently has no debt in its capital structure. The beta of its equity is...
Remex? (RMX) currently has no debt in its capital structure. The beta of its equity is 1.28. For each year into the indefinite? future, Remex's free cash flow is expected to equal ?$23 million. Remex is considering changing its capital structure by issuing debt and using the proceeds to buy back stock. It will do so in such a way that it will have a 25?% ?debt-equity ratio after the? change, and it will maintain this? debt-equity ratio forever. Assume...
How has the role of the hospital changed over time? Identify and discuss one of the...
 How has the role of the hospital changed over time? Identify and discuss one of the current trends that are likely to increase hospital use.
Which of the following statements is false in a Modigliani-Miller world? A. Capital structure does not...
Which of the following statements is false in a Modigliani-Miller world? A. Capital structure does not affect the cost of capital B. Higher leverage increase the cost of equity C. Higher leverage does not affect the WACC D. Higher leverage does not affect the cost of equity Which of the following is not an advantage of having large shareholders? A. Better coordination in monitoring management B. Executives more likely to be dismissed when underperforming C. Less shareholders' interference in the...
11. Determining the optimal capital structure Understanding the optimal capital structure Review this situation: Universal Exports...
11. Determining the optimal capital structure Understanding the optimal capital structure Review this situation: Universal Exports Inc. is trying to identify its optimal capital structure. Universal Exports Inc. has gathered the following financial information to help with the analysis. Debt Ratio Equity Ratio rdrd rsrs WACC 30% 70% 6.02% 9.40% 9.71% 40% 60% 6.75% 9.750% 9.55% 50% 50% 7.15% 10.60% 10.02% 60% 40% 7.55% 11.30% 10.78% 70% 30% 8.24% 12.80% 11.45% Which capital structure shown in the preceding table is...
How has spending on poverty changed over time in terms of types of support and types...
How has spending on poverty changed over time in terms of types of support and types of programs. How has this change affected the distribution of poverty spending among the poor?
please show in Excel Boom Mechanics is trying to determine its optimal capital structure, which now...
 please show in Excel
Boom Mechanics is trying to determine its optimal capital structure, which now consists of only debt and common equity. The firm does not Currently use preferred stock in its capital structure, and it does not plan to do so in the future. Its treasury staff has consulted with investment Dankers. On the basis of those discussions, the staff has created the following table showing the firm's debt cost at different debt levels: Debt-to-Equity-to Debt-to- Capital Capital...
please show in Excel
Boom Mechanics is trying to determine its optimal capital structure, which now consists of only debt and common equity. The firm does not Currently use preferred stock in its capital structure, and it does not plan to do so in the future. Its treasury staff has consulted with investment Dankers. On the basis of those discussions, the staff has created the following table showing the firm's debt cost at different debt levels: Debt-to-Equity-to Debt-to- Capital Capital...
 How has the role of the hospital changed over time? Identify and discuss one of the current trends that are likely to increase hospital use.
 please show in Excel
Boom Mechanics is trying to determine its optimal capital structure, which now consists of only debt and common equity. The firm does not Currently use preferred stock in its capital structure, and it does not plan to do so in the future. Its treasury staff has consulted with investment Dankers. On the basis of those discussions, the staff has created the following table showing the firm's debt cost at different debt levels: Debt-to-Equity-to Debt-to- Capital Capital...
please show in Excel
Boom Mechanics is trying to determine its optimal capital structure, which now consists of only debt and common equity. The firm does not Currently use preferred stock in its capital structure, and it does not plan to do so in the future. Its treasury staff has consulted with investment Dankers. On the basis of those discussions, the staff has created the following table showing the firm's debt cost at different debt levels: Debt-to-Equity-to Debt-to- Capital Capital...
Most questions answered within 3 hours.
-
You are attempting to calculate a firm’s free cash flow to
equity. You know the following...
asked 36 minutes ago -
the following reaction occurs in a balloon containing
N2O2 gas
N2O4(g)=2NO2(g)
will the volume of the...
asked 1 hour ago -
answer the questions throughout this program
public class Day implements Comparable {
Private Boolean atWork;...
asked 1 hour ago -
This is C++ code for parking fee management program
#include <iostream>
#include <iomanip>
using namespace std;...
asked 1 hour ago -
The free energy change for the following reaction at 25 °C, when
[Sn2+] = 1.17 M...
asked 3 hours ago -
An MNE is this kind of industry when competition in one country
is essentially independent of...
asked 4 hours ago -
. For this set of questions, determine what
proportion of a normal distribution is located betweeneach...
asked 5 hours ago -
A college student is employed as a door-to-door newspaper
salesman. Historical data suggests that the student...
asked 6 hours ago -
MATLAB HW 11 problem using Switch Case and Input commands
Write a script file that calculates...
asked 6 hours ago -
Considering gravitational time dilation, calculate the time that
passes in Earth’s surface while 1 hour passes...
asked 6 hours ago -
Minitab Problem: Take the Lake Hume June rainfall data and find
use the processes outlined in...
asked 7 hours ago -
X Company is trying to decide whether to continue using old
equipment to make Product A...
asked 7 hours ago