Simon Company’s year-end balance sheets follow. At December 31 2017 2016 2015 Assets Cash $ 35,662...
Simon Company’s year-end balance sheets follow.
| At December 31 | 2017 | 2016 | 2015 | ||||||
| Assets | |||||||||
| Cash | $ | 35,662 | $ | 42,962 | $ | 44,296 | |||
| Accounts receivable, net | 107,579 | 75,183 | 56,767 | ||||||
| Merchandise inventory | 131,281 | 97,382 | 62,302 | ||||||
| Prepaid expenses | 11,484 | 11,054 | 4,731 | ||||||
| Plant assets, net |
330,773 |
305,125 | 266,304 | ||||||
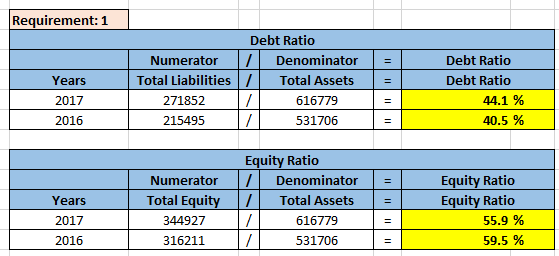
| Total assets | $ | 616,779 | $ | 531,706 | $ | 434,400 | |||
| Liabilities and Equity | |||||||||
| Accounts payable | $ | 153,578 | $ | 90,757 | $ | 56,194 | |||
| Long-term notes payable secured by mortgages on plant assets |
118,274 | 124,738 | 97,922 | ||||||
| Common stock, $10 par value | 162,500 | 162,500 | 162,500 | ||||||
| Retained earnings | 182,427 | 153,711 | 117,784 | ||||||
| Total liabilities and equity | $ | 616,779 | $ | 531,706 | $ | 434,400 | |||
The company’s income statements for the years ended December 31,
2017 and 2016, follow.
| For Year Ended December 31 | 2017 | 2016 | ||||||||||
| Sales | $ | 801,813 | $ | 632,730 | ||||||||
| Cost of goods sold | $ | 489,106 | $ | 411,275 | ||||||||
| Other operating expenses | 248,562 | 160,081 | ||||||||||
| Interest expense | 13,631 | 14,553 | ||||||||||
| Income taxes | 10,424 | 9,491 | ||||||||||
| Total costs and expenses | 761,723 | 595,400 | ||||||||||
| Net income | $ | 40,090 | $ | 37,330 | ||||||||
| Earnings per share | $ | 2.47 | $ | 2.30 | ||||||||
Calculate the company’s long-term risk and capital structure
positions at the end of 2017 and 2016 by computing the following
ratios.
(1) Debt and equity ratios.
Check my workCheck My Work button is now enabled2
Item 6
Item 6 Part 2 of 3 1.35 points Item Skipped
Time Remaining 2 hours 23 minutes 1 second
02:23:01
Required information
[The following information applies to the questions
displayed below.]
Simon Company’s year-end balance sheets follow.
| At December 31 | 2017 | 2016 | 2015 | ||||||
| Assets | |||||||||
| Cash | $ | 35,662 | $ | 42,962 | $ | 44,296 | |||
| Accounts receivable, net | 107,579 | 75,183 | 56,767 | ||||||
| Merchandise inventory | 131,281 | 97,382 | 62,302 | ||||||
| Prepaid expenses | 11,484 | 11,054 | 4,731 | ||||||
| Plant assets, net |
330,773 |
305,125 | 266,304 | ||||||
| Total assets | $ | 616,779 | $ | 531,706 | $ | 434,400 | |||
| Liabilities and Equity | |||||||||
| Accounts payable | $ | 153,578 | $ | 90,757 | $ | 56,194 | |||
| Long-term notes payable secured by mortgages on plant assets |
118,274 | 124,738 | 97,922 | ||||||
| Common stock, $10 par value | 162,500 | 162,500 | 162,500 | ||||||
| Retained earnings | 182,427 | 153,711 | 117,784 | ||||||
| Total liabilities and equity | $ | 616,779 | $ | 531,706 | $ | 434,400 | |||
The company’s income statements for the years ended December 31,
2017 and 2016, follow.
| For Year Ended December 31 | 2017 | 2016 | ||||||||||
| Sales | $ | 801,813 | $ | 632,730 | ||||||||
| Cost of goods sold | $ | 489,106 | $ | 411,275 | ||||||||
| Other operating expenses | 248,562 | 160,081 | ||||||||||
| Interest expense | 13,631 | 14,553 | ||||||||||
| Income taxes | 10,424 | 9,491 | ||||||||||
| Total costs and expenses | 761,723 | 595,400 | ||||||||||
| Net income | $ | 40,090 | $ | 37,330 | ||||||||
| Earnings per share | $ | 2.47 | $ | 2.30 | ||||||||
Calculate the company’s long-term risk and capital structure
positions at the end of 2017 and 2016 by computing the following
ratios.
(2) Debt-to-equity ratio.
Simon Company’s year-end balance sheets follow.
| At December 31 | 2017 | 2016 | 2015 | ||||||
| Assets | |||||||||
| Cash | $ | 35,662 | $ | 42,962 | $ | 44,296 | |||
| Accounts receivable, net | 107,579 | 75,183 | 56,767 | ||||||
| Merchandise inventory | 131,281 | 97,382 | 62,302 | ||||||
| Prepaid expenses | 11,484 | 11,054 | 4,731 | ||||||
| Plant assets, net |
330,773 |
305,125 | 266,304 | ||||||
| Total assets | $ | 616,779 | $ | 531,706 | $ | 434,400 | |||
| Liabilities and Equity | |||||||||
| Accounts payable | $ | 153,578 | $ | 90,757 | $ | 56,194 | |||
| Long-term notes payable secured by mortgages on plant assets |
118,274 | 124,738 | 97,922 | ||||||
| Common stock, $10 par value | 162,500 | 162,500 | 162,500 | ||||||
| Retained earnings | 182,427 | 153,711 | 117,784 | ||||||
| Total liabilities and equity | $ | 616,779 | $ | 531,706 | $ | 434,400 | |||
The company’s income statements for the years ended December 31,
2017 and 2016, follow.
| For Year Ended December 31 | 2017 | 2016 | ||||||||||
| Sales | $ | 801,813 | $ | 632,730 | ||||||||
| Cost of goods sold | $ | 489,106 | $ | 411,275 | ||||||||
| Other operating expenses | 248,562 | 160,081 | ||||||||||
| Interest expense | 13,631 | 14,553 | ||||||||||
| Income taxes | 10,424 | 9,491 | ||||||||||
| Total costs and expenses | 761,723 | 595,400 | ||||||||||
| Net income | $ | 40,090 | $ | 37,330 | ||||||||
| Earnings per share | $ | 2.47 | $ | 2.30 | ||||||||
Calculate the company’s long-term risk and capital structure
positions at the end of 2017 and 2016 by computing the following
ratios.
(3) Times interest earned.
Homework Answers

Add Answer to:
Simon Company’s year-end balance sheets follow. At December 31 2017 2016 2015 Assets Cash $ 35,662...
Simon Company’s year-end balance sheets follow. At December 31 2017 2016 2015 Assets Cash $ 31,600...
Simon Company’s year-end balance sheets follow. At December 31 2017 2016 2015 Assets Cash $ 31,600 $ 34,600 $ 36,000 Accounts receivable, net 89,200 64,400 55,700 Merchandise inventory 68,818 84,700 50,700 Prepaid expenses 10,613 9,438 3,852 Plant assets, net 369,769 251,862 193,748 Total assets $ 570,000 $ 445,000 $ 340,000 Liabilities and Equity Accounts payable $ 140,511 $ 73,701 $ 44,880 Long-term notes payable secured by mortgages on plant assets 109,303 104,397 74,389 Common stock, $10 par value 162,500 162,500...
Simon Company’s year-end balance sheets follow. At December 31 2017 2016 2015 Assets Cash $ 33,443...
Simon Company’s year-end balance sheets follow. At December 31 2017 2016 2015 Assets Cash $ 33,443 $ 39,092 $ 41,136 Accounts receivable, net 89,200 62,600 55,400 Merchandise inventory 115,000 85,000 56,000 Prepaid expenses 10,770 10,262 4,571 Plant assets, net 329,991 301,670 266,893 Total assets $ 578,404 $ 498,624 $ 424,000 Liabilities and Equity Accounts payable $ 141,142 $ 82,582 $ 54,849 Long-term notes payable secured by mortgages on plant assets 106,565 112,390 91,830 Common stock, $10 par value 162,500 162,500...
Simon Company’s year-end balance sheets follow. At December 31 2017 2016 2015 Assets Cash $ 29,607...
Simon Company’s year-end balance sheets follow. At December 31 2017 2016 2015 Assets Cash $ 29,607 $ 34,608 $ 35,690 Accounts receivable, net 89,500 62,600 57,300 Merchandise inventory 110,500 84,500 51,000 Prepaid expenses 9,535 9,085 3,965 Plant assets, net 262,674 241,807 212,545 Total assets $ 501,816 $ 432,600 $ 360,500 Liabilities and Equity Accounts payable $ 124,952 $ 73,109 $ 47,586 Long-term notes payable secured by mortgages on plant assets 94,341 99,498 79,671 Common stock, $10 par value 162,500 162,500...
Simon Company’s year-end balance sheets follow. At December 31 2017 2016 2015 Assets Cash $ 27,923...
Simon Company’s year-end balance sheets follow. At December 31 2017 2016 2015 Assets Cash $ 27,923 $ 33,985 $ 32,679 Accounts receivable, net 85,935 58,886 45,369 Merchandise inventory 105,949 76,257 47,839 Prepaid expenses 9,270 8,833 3,743 Plant assets, net 258,832 242,650 210,670 Total assets $ 487,909 $ 420,611 $ 340,300 Liabilities and Equity Accounts payable $ 119,060 $ 71,083 $ 46,267 Long-term notes payable secured by mortgages on plant assets 92,644 93,838 75,206 Common stock, $10 par value 162,500 162,500...
Simon Company’s year-end balance sheets follow. At December 31 2017 2016 2015 Assets Cash $ 36,335...
 Simon Company’s year-end balance sheets follow.
At December 31
2017
2016
2015
Assets
Cash
$
36,335
$
42,472
$
42,524
Accounts receivable, net
107,459
73,568
56,120
Merchandise inventory
139,163
102,226
60,994
Prepaid expenses
12,179
11,377
4,773
Plant assets, net
333,281
312,096
273,889
Total assets
$
628,417
$
541,739
$
438,300
Liabilities and Equity
Accounts payable
$
159,605
$
89,723
$
59,013
Long-term notes payable secured by
mortgages on plant assets
120,505
123,354
94,927
Common stock, $10 par value
162,500
162,500...
Simon Company’s year-end balance sheets follow.
At December 31
2017
2016
2015
Assets
Cash
$
36,335
$
42,472
$
42,524
Accounts receivable, net
107,459
73,568
56,120
Merchandise inventory
139,163
102,226
60,994
Prepaid expenses
12,179
11,377
4,773
Plant assets, net
333,281
312,096
273,889
Total assets
$
628,417
$
541,739
$
438,300
Liabilities and Equity
Accounts payable
$
159,605
$
89,723
$
59,013
Long-term notes payable secured by
mortgages on plant assets
120,505
123,354
94,927
Common stock, $10 par value
162,500
162,500...
Simon Company’s year-end balance sheets follow. At December 31 2017 2016 2015 Assets Cash $ 31,800...
 Simon Company’s year-end balance sheets follow.
At December 31
2017
2016
2015
Assets
Cash
$
31,800
$
36,000
$
37,200
Accounts receivable, net
88,100
62,000
50,500
Merchandise inventory
111,000
83,800
54,500
Prepaid expenses
10,300
9,350
4,600
Plant assets, net
280,000
257,000
235,000
Total assets
$
521,200
$
448,150
$
381,800
Liabilities and Equity
Accounts payable
$
129,200
$
75,250
$
50,400
Long-term notes payable secured by
mortgages on plant assets
98,000
100,000
82,600
Common stock, $10 par value
161,500
161,500...
Simon Company’s year-end balance sheets follow.
At December 31
2017
2016
2015
Assets
Cash
$
31,800
$
36,000
$
37,200
Accounts receivable, net
88,100
62,000
50,500
Merchandise inventory
111,000
83,800
54,500
Prepaid expenses
10,300
9,350
4,600
Plant assets, net
280,000
257,000
235,000
Total assets
$
521,200
$
448,150
$
381,800
Liabilities and Equity
Accounts payable
$
129,200
$
75,250
$
50,400
Long-term notes payable secured by
mortgages on plant assets
98,000
100,000
82,600
Common stock, $10 par value
161,500
161,500...
Simon Company’s year-end balance sheets follow. At December 31 2017 2016 2015 Assets Cash $ 27,904 $ 32...
 Simon Company’s year-end balance sheets follow.
At December 31
2017
2016
2015
Assets
Cash
$
27,904
$
32,617
$
34,676
Accounts receivable, net
89,700
62,600
59,700
Merchandise inventory
113,000
83,000
54,000
Prepaid expenses
8,986
8,562
3,853
Plant assets, net
247,981
233,541
208,871
Total assets
$
487,571
$
420,320
$
361,100
Liabilities and Equity
Accounts payable
$
117,763
$
68,903
$
46,235
Long-term notes payable secured by
mortgages on plant assets
88,913
93,773
77,409
Common stock, $10 par value
162,500
162,500...
Simon Company’s year-end balance sheets follow.
At December 31
2017
2016
2015
Assets
Cash
$
27,904
$
32,617
$
34,676
Accounts receivable, net
89,700
62,600
59,700
Merchandise inventory
113,000
83,000
54,000
Prepaid expenses
8,986
8,562
3,853
Plant assets, net
247,981
233,541
208,871
Total assets
$
487,571
$
420,320
$
361,100
Liabilities and Equity
Accounts payable
$
117,763
$
68,903
$
46,235
Long-term notes payable secured by
mortgages on plant assets
88,913
93,773
77,409
Common stock, $10 par value
162,500
162,500...
Simon Company’s year-end balance sheets follow. At December 31 2017 2016 2015 Assets Cash $ 31,800 $ 35...
Simon Company’s year-end balance sheets follow. At December 31 2017 2016 2015 Assets Cash $ 31,800 $ 35,625 $ 37,800 Accounts receivable, net 89,500 62,500 50,200 Merchandise inventory 112,500 82,500 54,000 Prepaid expenses 10,700 9,375 5,000 Plant assets, net 278,500 255,000 230,500 Total assets $ 523,000 $ 445,000 $ 377,500 Liabilities and Equity Accounts payable $ 129,900 $ 75,250 $ 51,250 Long-term notes payable secured by mortgages on plant assets 98,500 101,500 83,500 Common stock, $10 par value 163,500 163,500...
Simon Company's year-end balance sheets follow. 2017 2016 2015 At December 31 Assets Cash Accounts receivable,...
 Simon Company's year-end balance sheets follow. 2017 2016 2015 At December 31 Assets Cash Accounts receivable, net Merchandise inventory Prepaid expenses Plant assets, net Total assets Liabilities and Equity Accounts payable Long-term notes payable secured by mortgages on plant assets Common stock, $10 par value Retained earnings Total liabilities and equity $ 26,1225 30,846 $ 34,119 79,574 53,981 44,167 97,135 70,612 47,513 8,498 8,261 3,791 240,461 225, 274 205,010 $ 451,799 $ 389,474 $ 334,600 $ 114,746 $ 65,821 $...
Simon Company’s year-end balance sheets follow. At December 31 2017 2016 2015 Assets Cash $ 35,286...
 Simon Company’s year-end balance sheets follow.
At December 31
2017
2016
2015
Assets
Cash
$
35,286
$
41,246
$
40,887
Accounts receivable, net
101,276
68,676
54,516
Merchandise inventory
124,839
95,381
58,060
Prepaid expenses
11,143
10,407
4,634
Plant assets, net
308,101
284,846
254,903
Total assets
$
580,645
$
500,556
$
413,000
Liabilities and
Equity
Accounts payable
$
143,135
$
86,286
$
55,606
Long-term notes payable secured
by
mortgages on plant assets
111,344
117,430
93,098
Common stock, $10 par value
162,500
162,500...
Simon Company’s year-end balance sheets follow.
At December 31
2017
2016
2015
Assets
Cash
$
35,286
$
41,246
$
40,887
Accounts receivable, net
101,276
68,676
54,516
Merchandise inventory
124,839
95,381
58,060
Prepaid expenses
11,143
10,407
4,634
Plant assets, net
308,101
284,846
254,903
Total assets
$
580,645
$
500,556
$
413,000
Liabilities and
Equity
Accounts payable
$
143,135
$
86,286
$
55,606
Long-term notes payable secured
by
mortgages on plant assets
111,344
117,430
93,098
Common stock, $10 par value
162,500
162,500...
 Simon Company’s year-end balance sheets follow.
At December 31
2017
2016
2015
Assets
Cash
$
36,335
$
42,472
$
42,524
Accounts receivable, net
107,459
73,568
56,120
Merchandise inventory
139,163
102,226
60,994
Prepaid expenses
12,179
11,377
4,773
Plant assets, net
333,281
312,096
273,889
Total assets
$
628,417
$
541,739
$
438,300
Liabilities and Equity
Accounts payable
$
159,605
$
89,723
$
59,013
Long-term notes payable secured by
mortgages on plant assets
120,505
123,354
94,927
Common stock, $10 par value
162,500
162,500...
Simon Company’s year-end balance sheets follow.
At December 31
2017
2016
2015
Assets
Cash
$
36,335
$
42,472
$
42,524
Accounts receivable, net
107,459
73,568
56,120
Merchandise inventory
139,163
102,226
60,994
Prepaid expenses
12,179
11,377
4,773
Plant assets, net
333,281
312,096
273,889
Total assets
$
628,417
$
541,739
$
438,300
Liabilities and Equity
Accounts payable
$
159,605
$
89,723
$
59,013
Long-term notes payable secured by
mortgages on plant assets
120,505
123,354
94,927
Common stock, $10 par value
162,500
162,500...
 Simon Company’s year-end balance sheets follow.
At December 31
2017
2016
2015
Assets
Cash
$
31,800
$
36,000
$
37,200
Accounts receivable, net
88,100
62,000
50,500
Merchandise inventory
111,000
83,800
54,500
Prepaid expenses
10,300
9,350
4,600
Plant assets, net
280,000
257,000
235,000
Total assets
$
521,200
$
448,150
$
381,800
Liabilities and Equity
Accounts payable
$
129,200
$
75,250
$
50,400
Long-term notes payable secured by
mortgages on plant assets
98,000
100,000
82,600
Common stock, $10 par value
161,500
161,500...
Simon Company’s year-end balance sheets follow.
At December 31
2017
2016
2015
Assets
Cash
$
31,800
$
36,000
$
37,200
Accounts receivable, net
88,100
62,000
50,500
Merchandise inventory
111,000
83,800
54,500
Prepaid expenses
10,300
9,350
4,600
Plant assets, net
280,000
257,000
235,000
Total assets
$
521,200
$
448,150
$
381,800
Liabilities and Equity
Accounts payable
$
129,200
$
75,250
$
50,400
Long-term notes payable secured by
mortgages on plant assets
98,000
100,000
82,600
Common stock, $10 par value
161,500
161,500...
 Simon Company’s year-end balance sheets follow.
At December 31
2017
2016
2015
Assets
Cash
$
27,904
$
32,617
$
34,676
Accounts receivable, net
89,700
62,600
59,700
Merchandise inventory
113,000
83,000
54,000
Prepaid expenses
8,986
8,562
3,853
Plant assets, net
247,981
233,541
208,871
Total assets
$
487,571
$
420,320
$
361,100
Liabilities and Equity
Accounts payable
$
117,763
$
68,903
$
46,235
Long-term notes payable secured by
mortgages on plant assets
88,913
93,773
77,409
Common stock, $10 par value
162,500
162,500...
Simon Company’s year-end balance sheets follow.
At December 31
2017
2016
2015
Assets
Cash
$
27,904
$
32,617
$
34,676
Accounts receivable, net
89,700
62,600
59,700
Merchandise inventory
113,000
83,000
54,000
Prepaid expenses
8,986
8,562
3,853
Plant assets, net
247,981
233,541
208,871
Total assets
$
487,571
$
420,320
$
361,100
Liabilities and Equity
Accounts payable
$
117,763
$
68,903
$
46,235
Long-term notes payable secured by
mortgages on plant assets
88,913
93,773
77,409
Common stock, $10 par value
162,500
162,500...
 Simon Company's year-end balance sheets follow. 2017 2016 2015 At December 31 Assets Cash Accounts receivable, net Merchandise inventory Prepaid expenses Plant assets, net Total assets Liabilities and Equity Accounts payable Long-term notes payable secured by mortgages on plant assets Common stock, $10 par value Retained earnings Total liabilities and equity $ 26,1225 30,846 $ 34,119 79,574 53,981 44,167 97,135 70,612 47,513 8,498 8,261 3,791 240,461 225, 274 205,010 $ 451,799 $ 389,474 $ 334,600 $ 114,746 $ 65,821 $...
 Simon Company’s year-end balance sheets follow.
At December 31
2017
2016
2015
Assets
Cash
$
35,286
$
41,246
$
40,887
Accounts receivable, net
101,276
68,676
54,516
Merchandise inventory
124,839
95,381
58,060
Prepaid expenses
11,143
10,407
4,634
Plant assets, net
308,101
284,846
254,903
Total assets
$
580,645
$
500,556
$
413,000
Liabilities and
Equity
Accounts payable
$
143,135
$
86,286
$
55,606
Long-term notes payable secured
by
mortgages on plant assets
111,344
117,430
93,098
Common stock, $10 par value
162,500
162,500...
Simon Company’s year-end balance sheets follow.
At December 31
2017
2016
2015
Assets
Cash
$
35,286
$
41,246
$
40,887
Accounts receivable, net
101,276
68,676
54,516
Merchandise inventory
124,839
95,381
58,060
Prepaid expenses
11,143
10,407
4,634
Plant assets, net
308,101
284,846
254,903
Total assets
$
580,645
$
500,556
$
413,000
Liabilities and
Equity
Accounts payable
$
143,135
$
86,286
$
55,606
Long-term notes payable secured
by
mortgages on plant assets
111,344
117,430
93,098
Common stock, $10 par value
162,500
162,500...
Most questions answered within 3 hours.
-
I am suppose to have my array before the main class but I am
getting the...
asked 17 seconds ago -
Your task is to design the page table for the 32bit Pentium
microprocessor. Answer the following...
asked 6 minutes ago -
The Paradise Shoes Company has estimated its weekly TVC function
from data collected over the past...
asked 5 minutes ago -
A researcher wishes to study the cumulative effects of several
combinations of HIV drugs. There are...
asked 5 minutes ago -
Although Epicurus advocates pursuing pleasure for the
good life, discuss a few reasons why he does...
asked 22 minutes ago -
Problem 1: Present entries to record the selected transactions
described below:
(a)
Issued $2,790,000 of 5-year,...
asked 29 minutes ago -
Using technology to support HR activities increases:
a.
the efficiency of the administrative HR functions.
b....
asked 29 minutes ago -
1. List the features used to classify leaf
types.
2. List some characteristics that are shared...
asked 34 minutes ago -
The three elements of Value Proposition, Key Customers, and
Capabilities operate within an environment. Which of...
asked 37 minutes ago -
Katelynn, a physician, earns $200,000 from her medical practice
in the current year. She receives $45,000...
asked 44 minutes ago -
Each row of the table below describes an aqueous solution at
25°C
.
The second column...
asked 49 minutes ago -
A horizontal wire is at y = 0. Current travels in the +x
direction. The magnetic...
asked 49 minutes ago